Population monitoring of moose (Alces alces) occurs in almost all European and North American countries in some form, though the techniques used, and depth of information collected can vary significantly (Moll et al., 2023). Extensive efforts for population monitoring include aerial surveys (Hinton et al., 2022; Janík et al., 2021; Sovie et al., 2024), cameras (Boone et al., 2025; Sirén et al., 2024; Spitzer et al., 2024) or integrated population monitoring or reconstruction (Berg et al., 2025; Kalén et al., 2022; Severud et al., 2022) have been conducted since previous population surveys (Timmermann and Rodgers 2017; Jensen et al., 2020). Herein, we sought to update the status and management of moose in North American (circa 2015; Timmerman & Rodgers, 2017) and in Europe (circa 2010; Jensen et al., 2020), covering 3 broad topical themes; population status, management impacts, and population management and research, using a comprehensive digital questionnaire.
METHODS
We contacted wildlife managers and researchers in each country in North America and Europe with a free-ranging moose population from November 2024 - March 2025. In the case of Canada, we reached out to provincial representatives, and for the US we contacted state, federal and tribal representatives. We developed a digital survey (Supplementary Material 1) using Alchemer Survey software (Alchemer, Louisville, CO, USA) to cover 3 broad themes; Population Status (abundance, range, demographics and survival), Management Impacts (hunter harvest, predation, and disease), and Population Management and Research (policy, research and future concerns). A total of 77 representatives were contacted directly; however the total number of recipients is unknown because we encouraged individuals to forward the survey to other parties if appropriate.
Respondents were asked to “identify the current population estimate” and were given the choice to provide a precise estimate or to select from 1 of 10 scaling numerical bins (e.g. “1,000-2,500”, “10,000-25,000”, “100,000-250,000”; see Supplementary Material 1). The ability to select an approximate bin resulted in a range of abundance, with a conservative estimate that represents the minimum regional moose population and a liberal estimate that represents an estimated population maximum. We used the median value when calculating a mean population. To compare current population estimates to past works for North America, we created a “conservative population estimate”, that utilized the lower value when participants provided a range of values (e.g., “120,000—150,000”). Additionally, respondents were asked to describe the population trend over the most recent 5-year period. Population estimates for Ukraine and Belarus were collected through government websites or previously published literature (Jensen et al., 2020). We asked respondents to provide estimates of calves per 100 cows, bulls per 100 cows and twinning rate from their 5 most recent sampling periods. We quantified twinning as the percentage of twins produced from adult females who gave birth to a calf in the sample year.
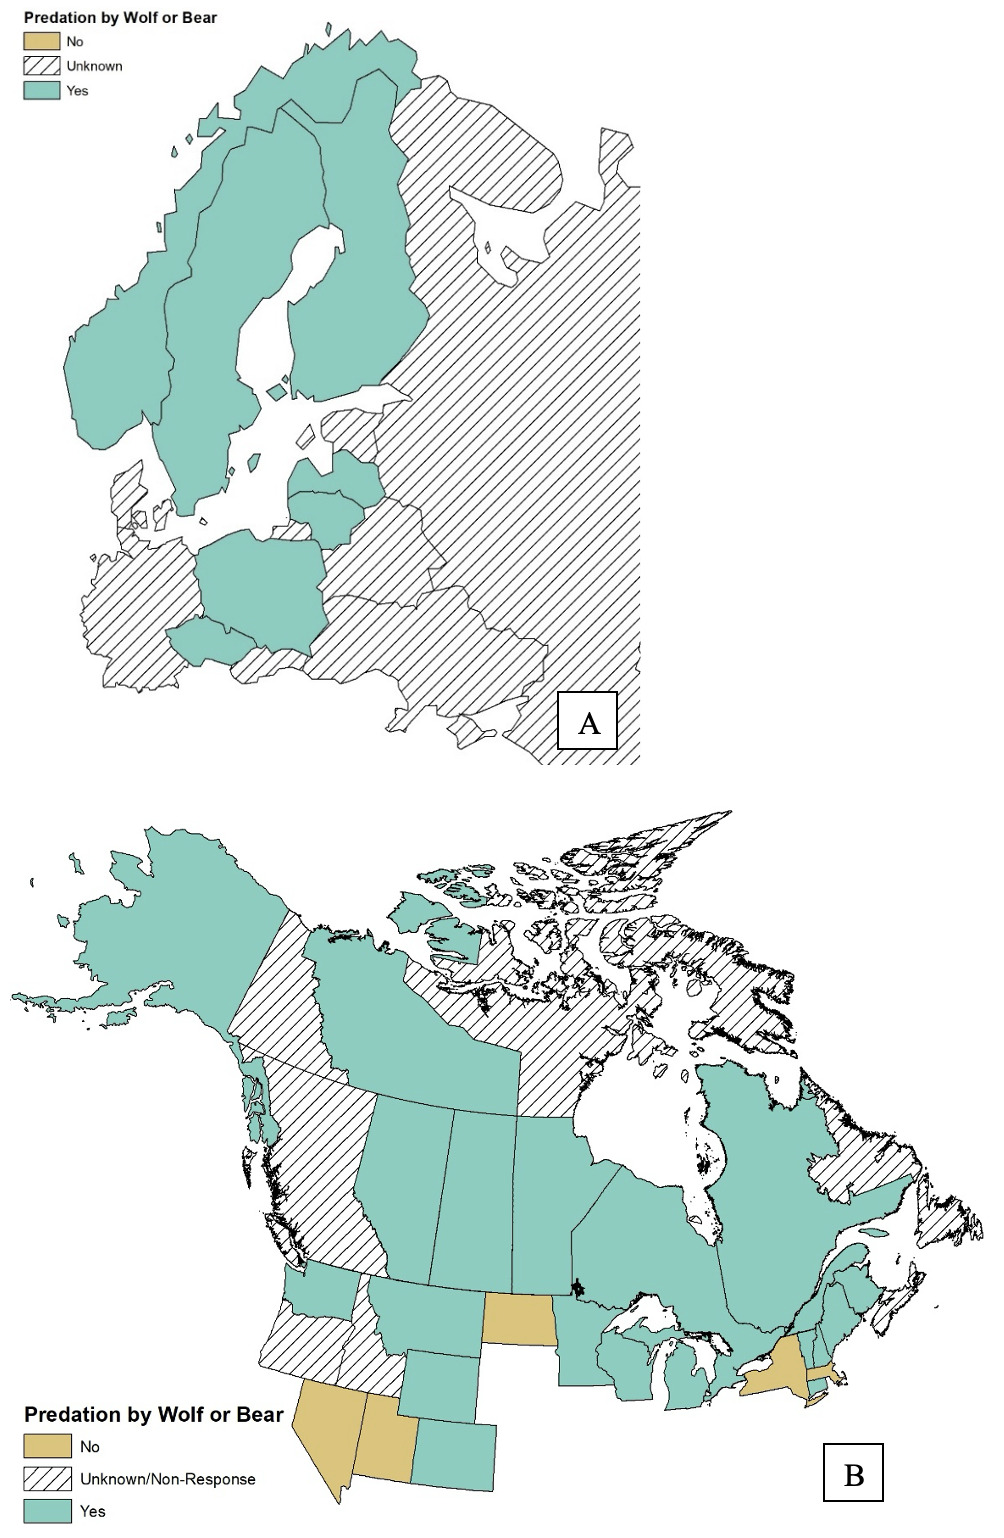
We asked if each jurisdiction is predation from wolves (Canis lupus), black bear (Ursus americanus) and/or brown bears (Ursus arctos) occurred but were not asked about the impact of predation on the moose population. Respondents were also asked about predation by smaller/non-listed predators and allowed respondents to write-in which predators were present. Respondents were asked to select from a list of eight common parasites/diseases, though not all listed options were present worldwide (e.g., winter tick, Dermacentor spp.). Additionally, respondents were provided with the opportunity to choose “Other” and write in an alternative if a parasite/disease impacting their moose population was not provided.
Respondents were asked whether their jurisdiction’s governing body had an official moose management plan or policy. Next, respondents were provided a list of 12 population metrics and were asked to select and rank which metrics were used to influence moose harvest regulations/tag allotments in their jurisdiction, a write-in response was available if needed. Respondents were asked a follow-up question to identify their current moose management concerns and challenges when making management decision. Respondents were asked to select a maximum of three challenges/concerns, from a list of 13 topics, with an additional option to write-in. Respondents were then asked if climate change impacted any of their previously selected challenges/concerns and to denote which of their three selections (if any) were impacted by climate change.
RESULTS
Surveys were returned from 9 European representatives, 10 Canadian, 18 American, and 5 from Federal or Tribal lands within the USA (Supplementary Material 2), however not all respondents filled out the survey in its entirety. In cases where jurisdictions did not respond to the survey inquiry, population abundance was collected using agency white papers when available (e.g. Idaho Moose Management Plan 2020-2025; IDFG 2020).
Population Status and Demographics
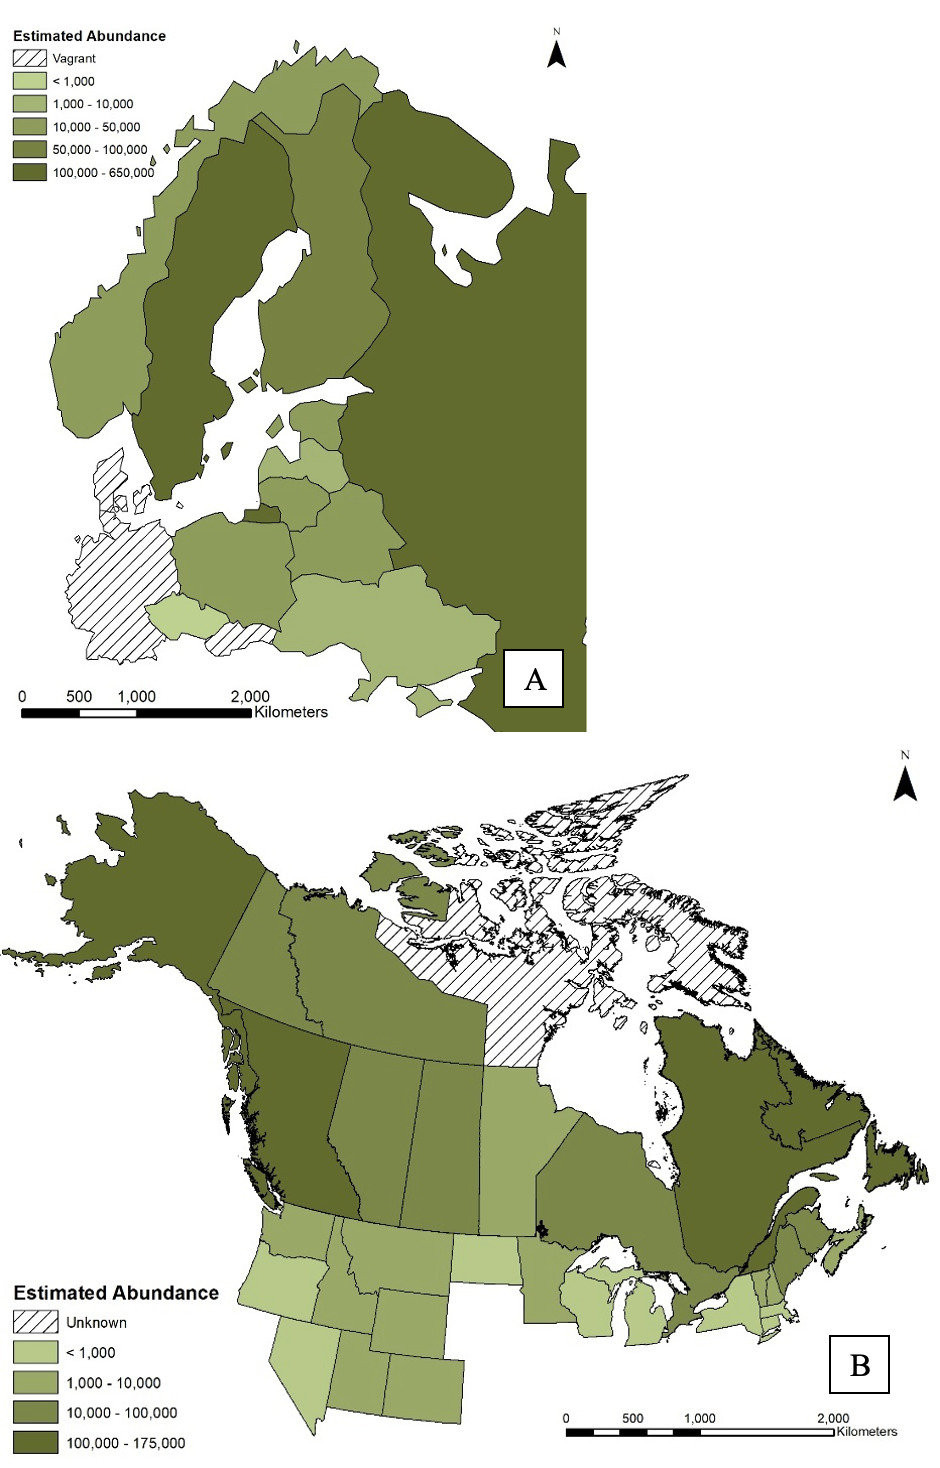
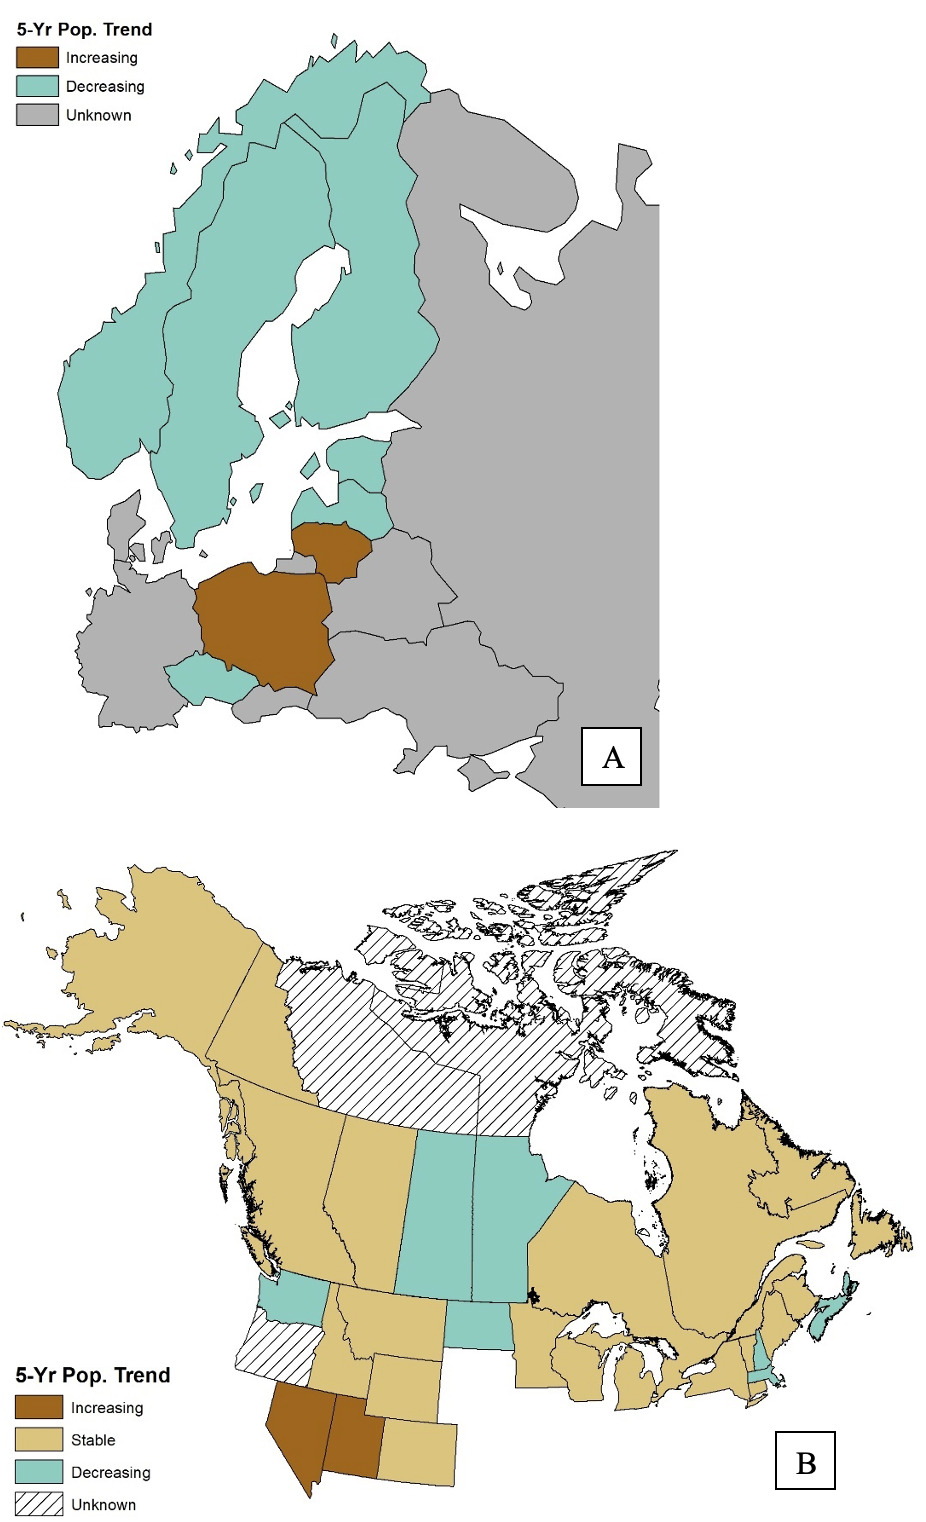
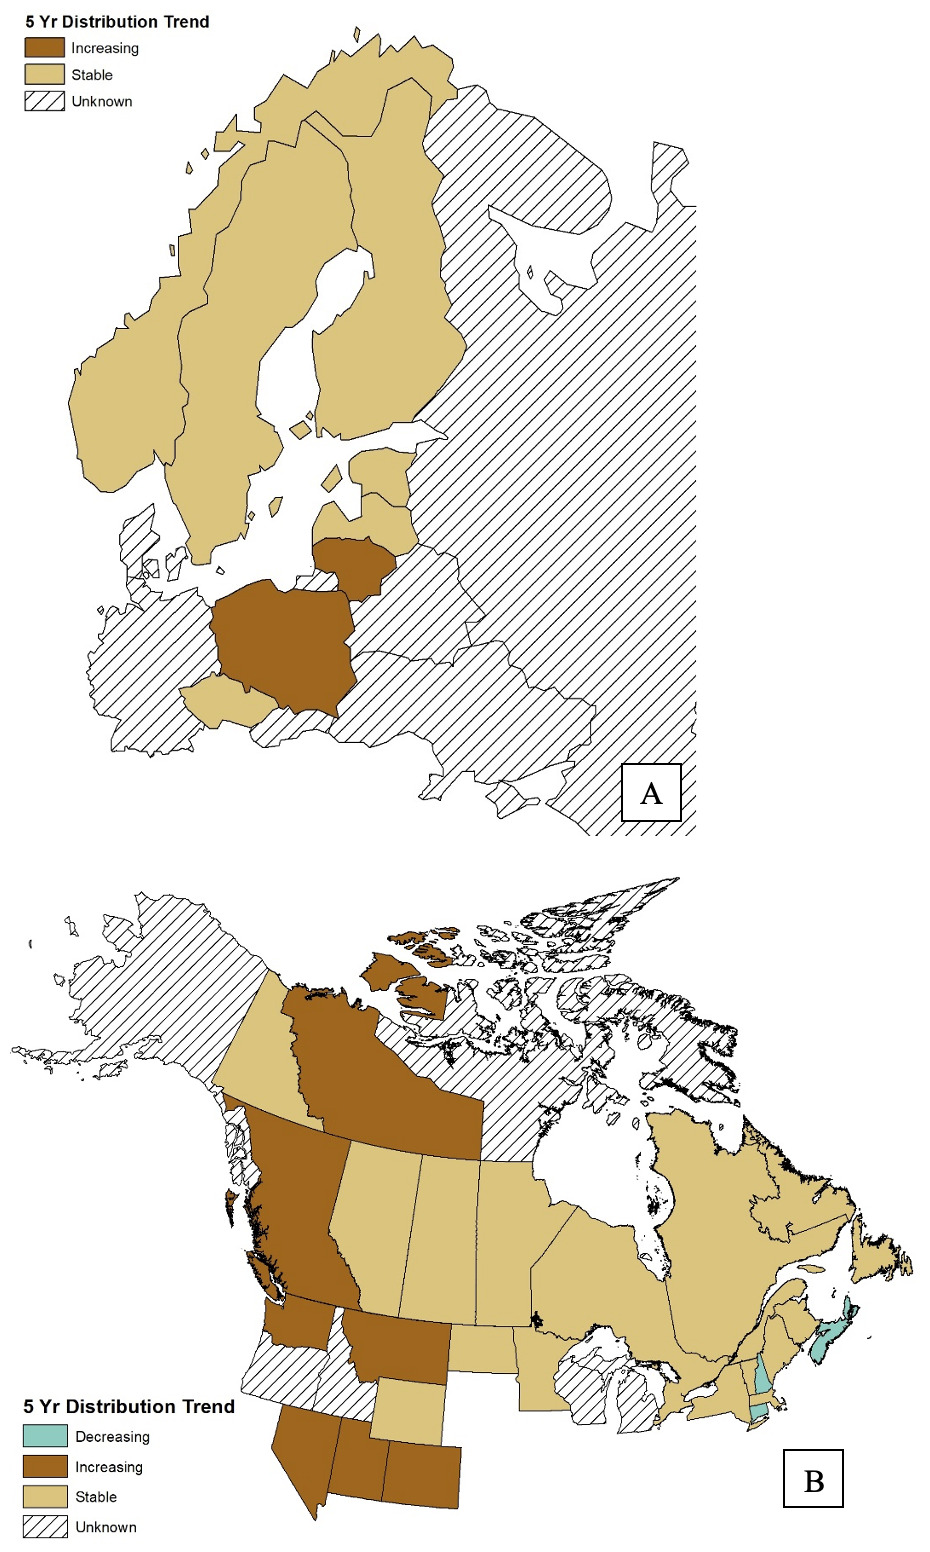
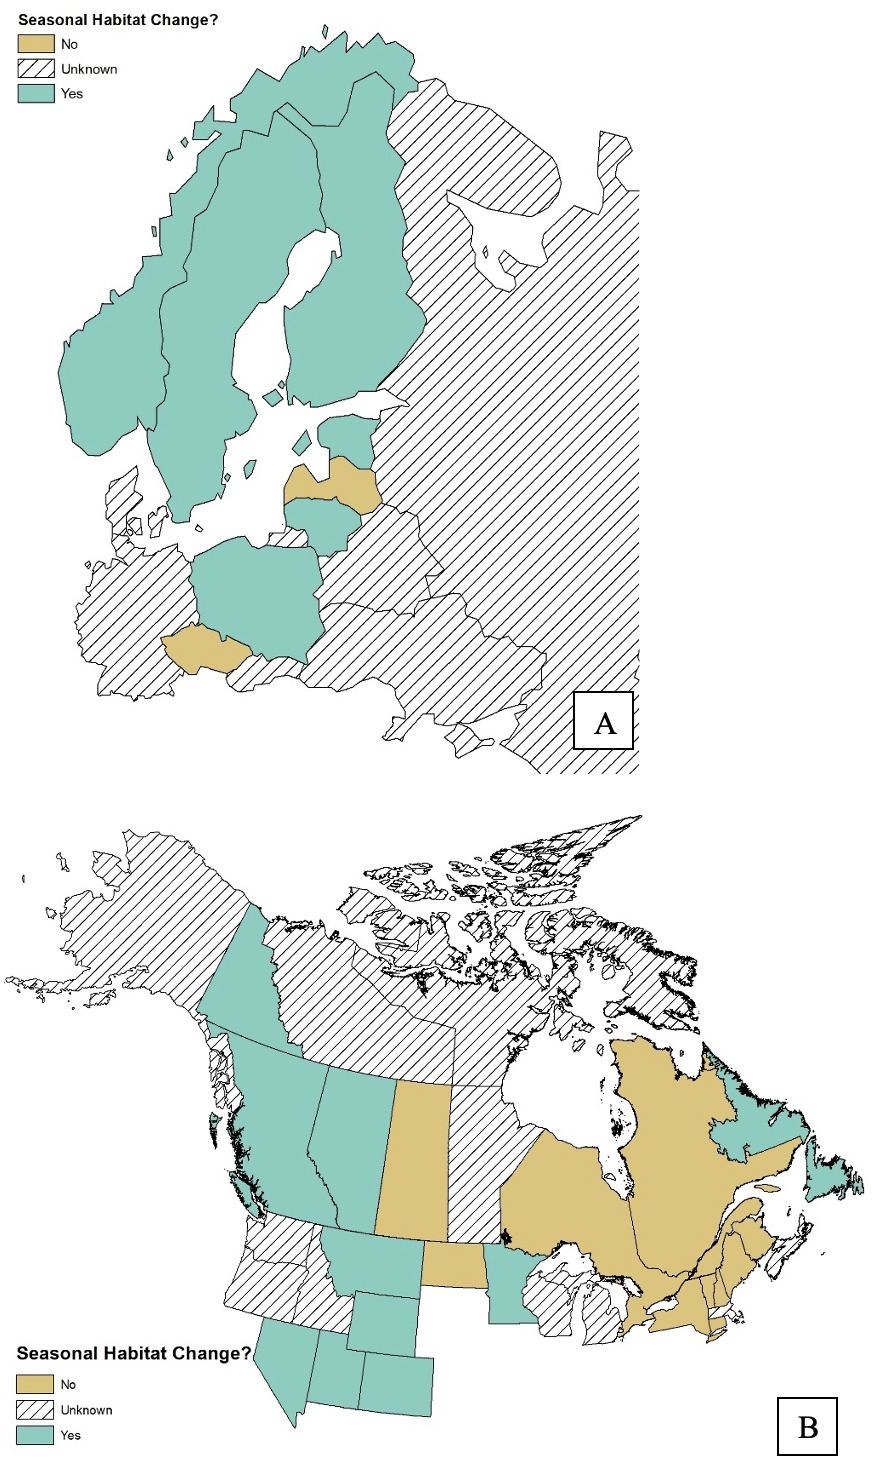
The current population estimate of the European continent (Russia excluded) ranged from 300,000 to 600,000 moose (Table 1; Supplementary Material 3). The Russian Federation contributed another 1.3 million individuals, for a total of 1,700,000 to 1,950,000 for Eurasia (excluding China, Mongolia and Kazakhstan). The population estimate for North America ranged between 910,494 to 1,423,044. The North American estimate excluded the Canadian province of Nunavut but did include the US National Parks (e.g. Isle Royale, Michigan) and tribal lands (e.g. Blackfeet Reservation, Montana) where estimates were available. Additionally, overall population trends (Table 2; Supplementary Material 4) over the past 5 years suggest that worldwide moose were either stable or declining, 6 of the 38 respondents stating that their population has been increasing over the past 5 years. The majority of moose populations in North America were stable (18 of 29), whereas the majority of European respondents were decreasing (6 of 8). Distributional trends of moose were largely unchanged over the past 5 years, with 23 of the 35 respondents suggesting a stable distributional range (Table 3; Supplementary Material 5). Only 4 jurisdictions indicated a distributional decline and all 4 of those were in North American (1 Canada, 3 US). Additionally, when respondents were asked whether the moose population exhibited seasonal migration across differing habitats in some or all of their juristiction, 17 juristictions expressed that there was at least localized migration (Table 4; Supplementary Material 6).
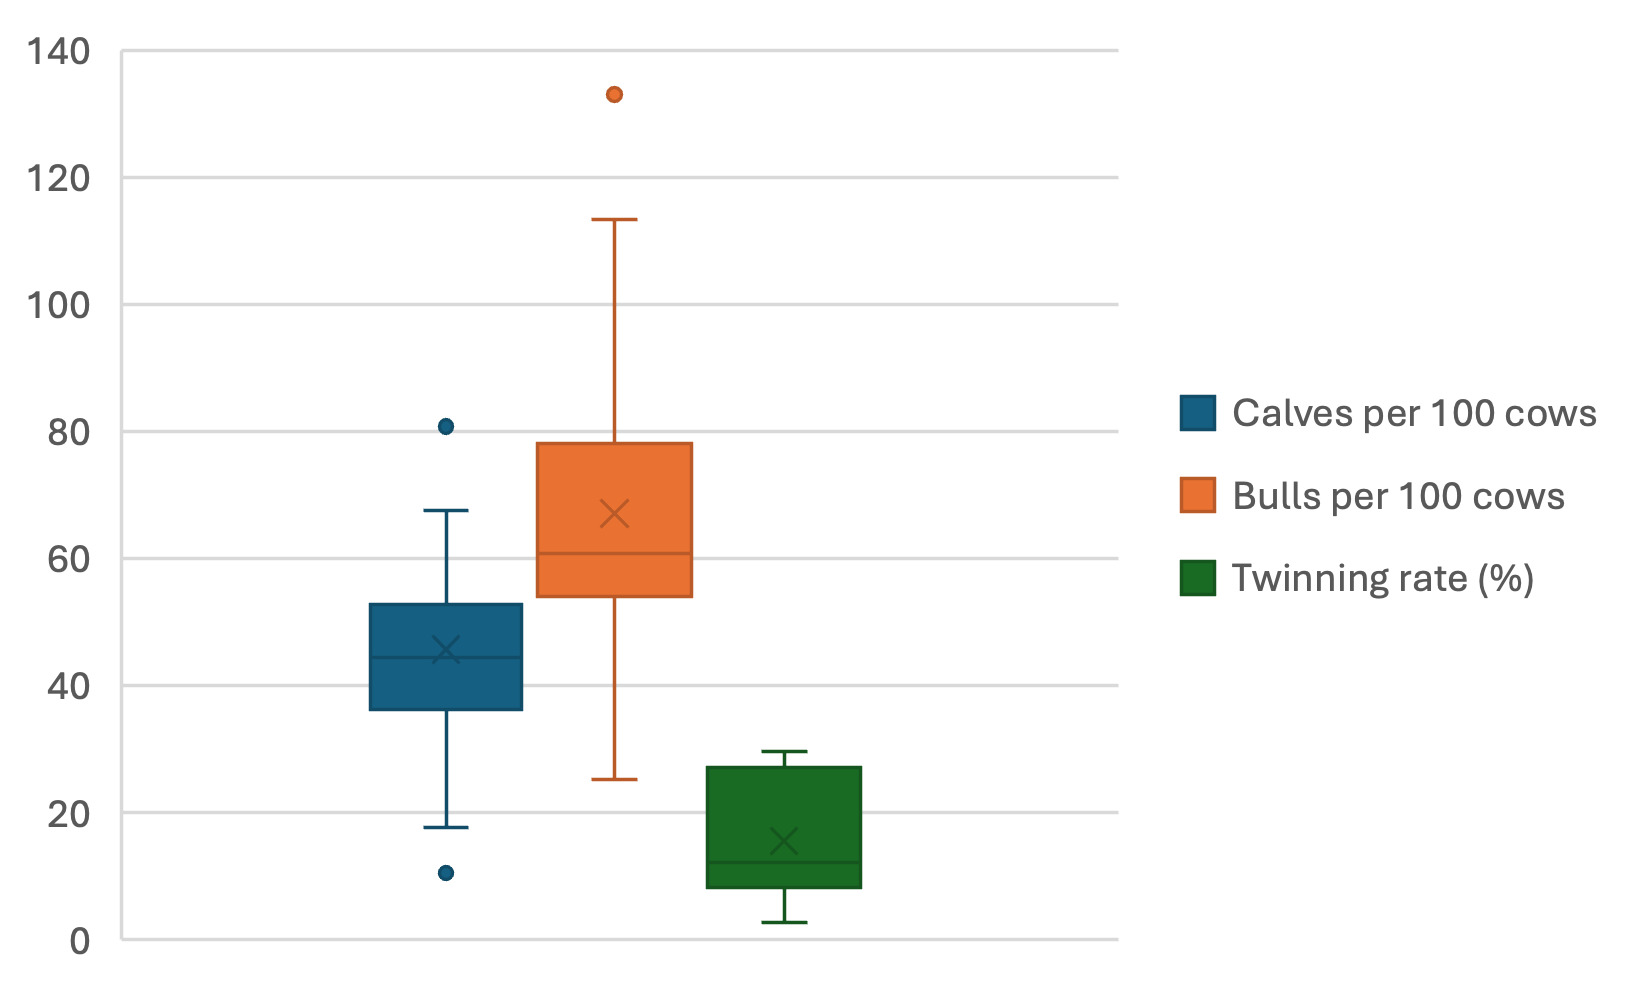
Twenty−six jurisdictions provided at least 1 of the 3 recruitment indices, and the majority of the data sampling occurred within the last 5 years, though a few jurisdictions provided information dating as far back as 1995 (Table 5). We calculated an average value for each of the 3 demographic fields for each jurisdiction for the sake of simplicity. There was a wide range for all 3 metrics across the responding jurisdictions with an average calves per 100 cows of 45.7 (min/max = 10.5 – 81.4), an average bulls per 100 cows of 66.3 (min/max = 25.2 – 133.0) and an average twinning rate of 15.5 (min/max = 2.7 – 29.7).
Harvest, Predation and Disease
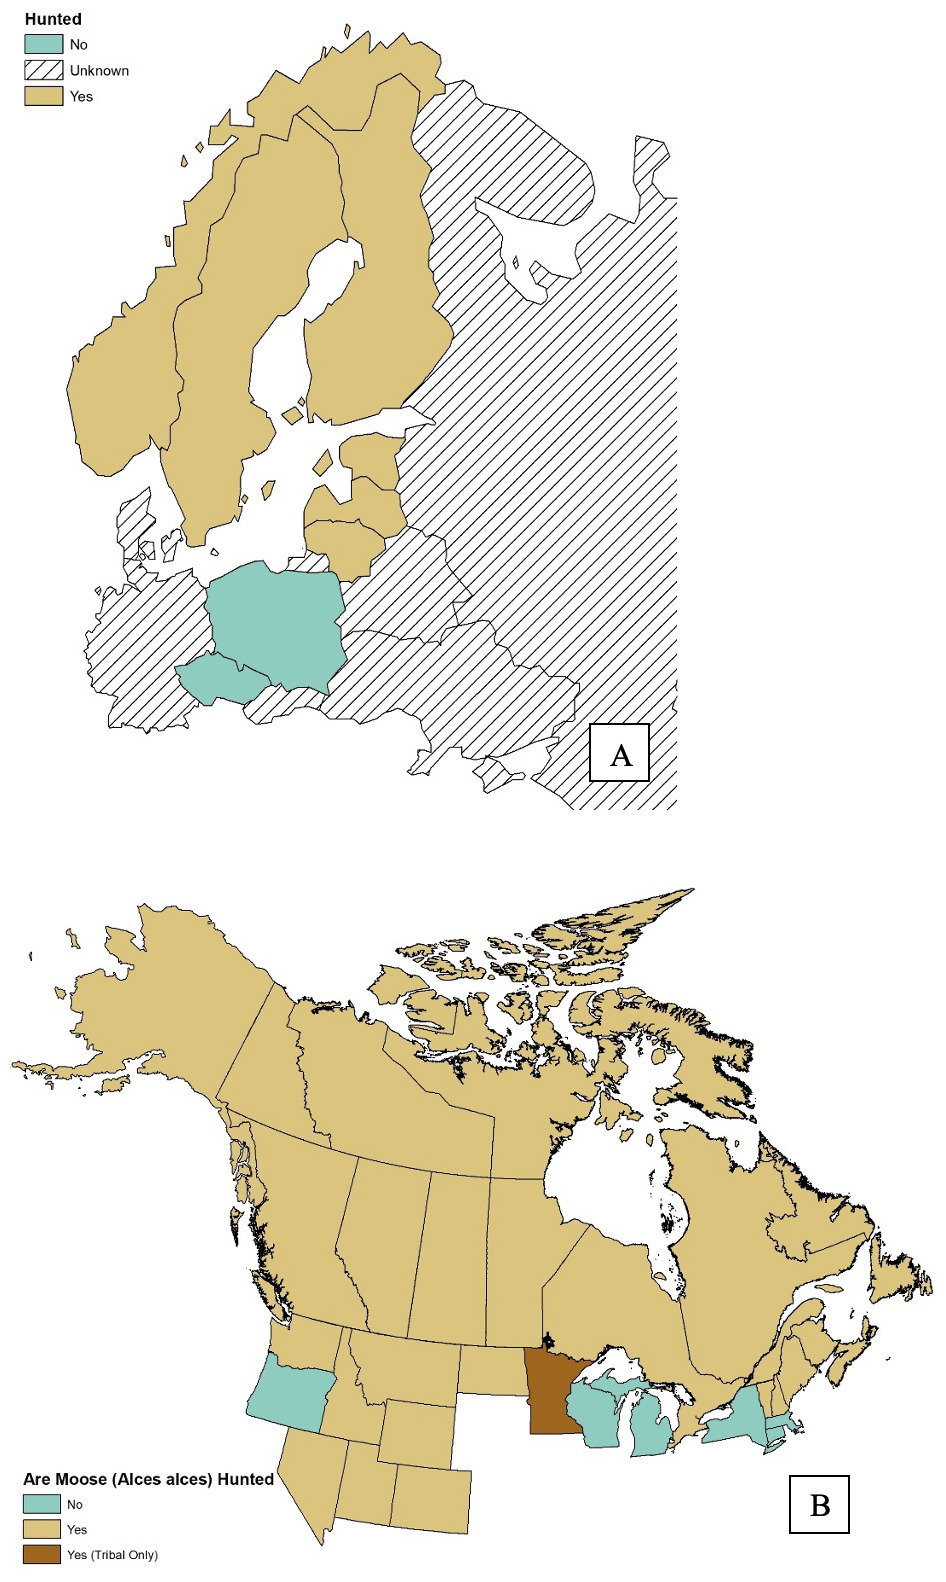
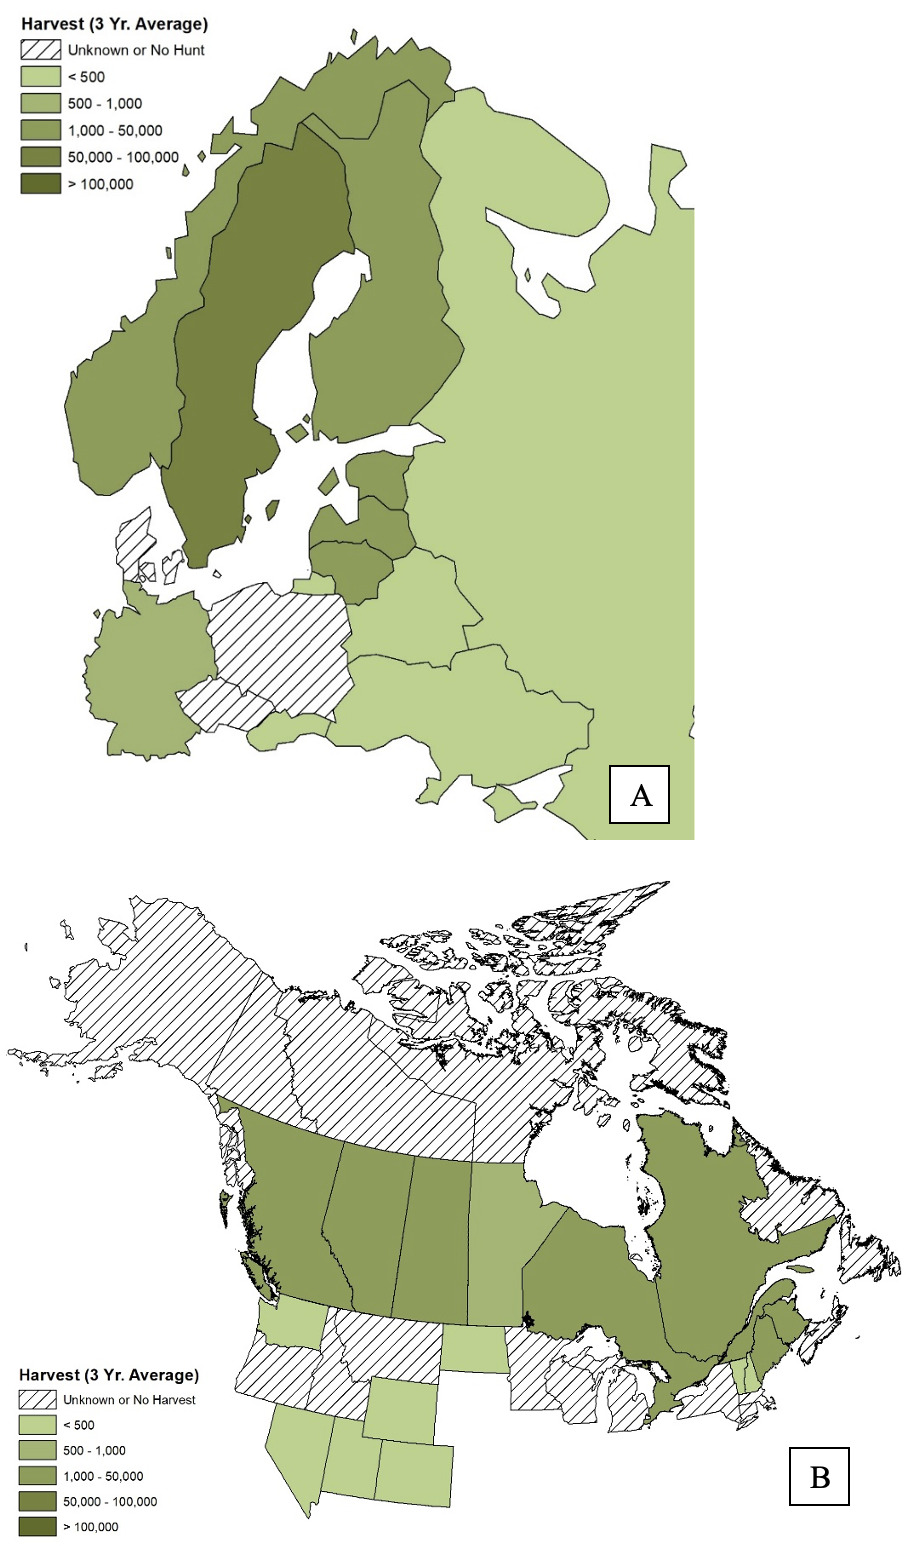
We identified 33 provinces, countries, states or tribal lands where moose are hunted (Supplementary Material 7), with moose harvested in the majority of their range in Canada and Europe but only being huntable in two-thirds of the US states that contain moose populations (Table 6). In regions where moose were hunted, 3-year average annual harvest estimates ranged from as low as 2 (Nevada, USA) to as many as 56,000 (Sweden; Supplementary Material 8).
Wildlife managers across the surveyed regions reported the presence of several large carnivore species. Respondents from 29 jurisdictions cited having wolf, black bears and/or brown bears (Table 7; Supplementary Material 9). Additionally, 8 jurisdictions cited additional predation from coyotes (Canis latrans; Poland, Alberta, Quebec, Newfoundland and Labrador, Colorado, Massachusetts), cougars (Puma concolor; Alberta, Montana), lynx (Lynx canadensis; Quebec, Newfoundland and Labrador), bald eagles (Haliaeetus leucocephalus; Newfoundland and Labrador) and wolverines (Gulo gulo; Sweden).
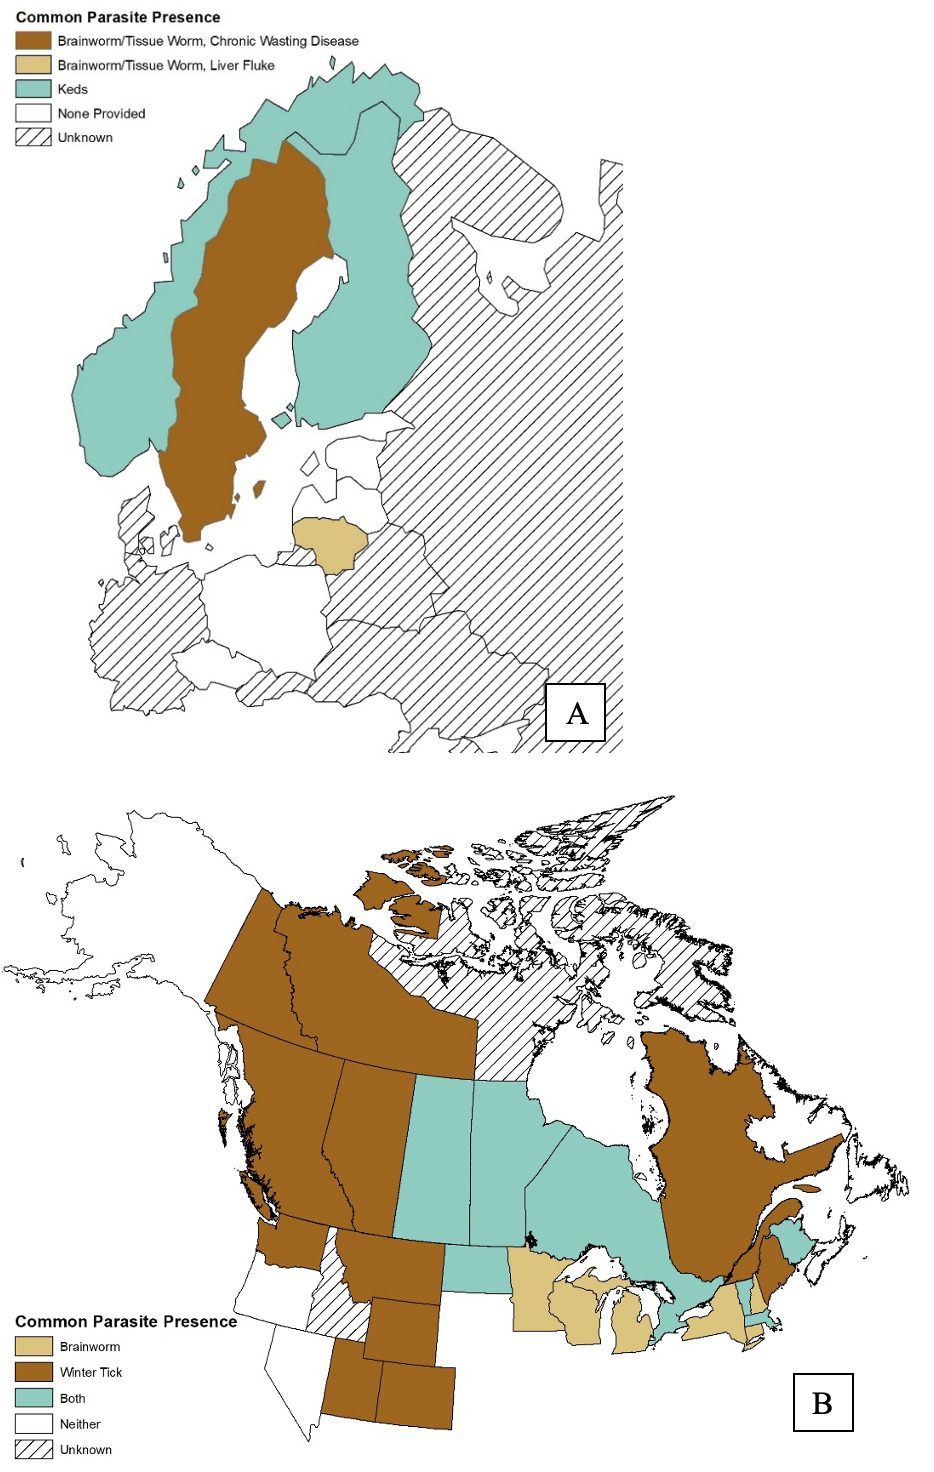
Winter tick and brainworm/tissueworm (Parelaphostrongylosis spp./ Elaphostrongylosis spp.) were the most commonly selected parasites (n = 19 and n = 16, respectively), with liver fluke (Fascioloidiasis spp.) the third most selection, noted in 4 jurisdictions (Table 8; Supplementary Material 10). The majority of jurisdictions with winter tick and/or brainworm were in North America, with only Lithuania and Sweden documenting tissueworm. Additionally, when respondents were asked what the impact trend of their selected parasites were having on the moose population, one−third of responses cited an increasing trend in impacts on their moose population, and no respondents suggested impacts were declining (Table 9).
Population Management and Research
Population abundance, population trajectory and bull:cow ratios were the most frequently selected metrics; population abundance was the metric most frequently ranked as the primary tool for informing decision making (Table 10). The majority of respondents sponsored moose research either internally or externally, with every response from the US stating that they sponsorored research (n = 19), but only 5 and 3 respondents sponsoring research from Canada and Europe, respectively. The top 3 concerns and challenges were “population modeling”, “disease/parasite”, and “habitat quality/change” (n = 16, 15, and 12, respectively; Table 11). Notably, there were 4 write-ins, 3 for multi-species management and 1 for unbalanced sex-ratio, and the option of “Resource Extraction” received no votes. Two-thirds of respondents answered “yes” when asked if their primary concerns and challenges were being impacted by climate change (n = 23; Table 12). “Disease/Parasite, Nutritional” “Condition/Productivity/Animal Quality”, and “Habitat Quality/Change” were selected as the most common management challenges or concerns (Table 13).
The majority of jurisdictions had a moose plan/policy currently in place (n = 16), while 13 did not and 6 were in the process of developing a plan or policy (Supplementary Material 11). Additionally, the majority of jurisdictions had a dedicated process to secure input from either public and/or Indigenous peoples’ input on the development of those plans and policies (n = 21; Supplementary Material 12), with every responding Canadian province including Indigenous input (n = 6). Lastly, when asked whether predation is a consideration when making management decisions, the majority of respondents stated that they did not incorporate predation (n = 21).
DISCUSSION
The North American estimate of 960,494 to 1,323,044 falls within the range of the previous estimates of 935,635—1,050,635 in 2001 (Timmerman, 2003), and 1,082,020—1,089,020 in 2014 (Timmerman & Rodgers, 2017), although we note that previous attempts to quantify regional moose populations have used slightly inconsistent methods. In the case of Timmerman (2003), the author requested precise estimates of moose populations from respondents but did accept responses from 5 jurisdictions that included a range of values with the most ranges +/- 10-15%, with the exception of British Columbia (130,000−200,000). Past works (Timmerman, 2003; Timmerman & Buss, 1995; Timmerman & Rodgers, 2017) requested an exact estimate of total post-hunt population and the year of estimate, resulting in a discrete population estimate for their sampling period (2014-15). Our survey allowed for either known discrete population estimates or the selection of a range of values (e.g., “500—100”); however, it is important to note that our bins increased in size as the overall population size increased, with our largest bin being “100,000−250,000”. This discrepancy in data collection has led to a greater variation in our population estimate than in previous work, making direct comparisons difficult.
Our conservative estimate suggests that at minimum the North American moose population has increased since the 1980’s, although it is unclear if the decline from 2014 to 2025 was due to an actual population decline due to the large population bin sizes we used for jurisdictions with populations greater than 100,000 (Table 14). We also report periodic moose harvest estimates from 1972-2015 (Table 15), but without additional metrics such as tags issued, success rates or hunter effort, it is difficult to make any inference about the impact of harvest on population estimates. Lastly, many European jurisdictions are experiencing a population decline both in the short-term (i.e., 5-year trend) and the long-term (2010-2024), except for Lithuania, Poland and Ukraine, which evidently experienced population increases (Table 16).
In wildlife management, reproductive rate, sex ratio, and twinning rate are often used as indicators of population quality and health status. It is noteworthy that our survey revealed substantial variation in these parameters (Figure 1). In Scandinavia, these metrics were measured in the fall at the onset of the hunting season through data collected from hunters (citizen science) (Crichton, 1993; Ericsson & Wallin, 1999; Solberg & Sæther, 1999). Because summer mortality has already influenced reproduction by that time, it is more appropriate to interpret these values as the recruitment of calves into the population.

The Scandinavian countries (Finland, Sweden and Norway) reported substantially higher recruitment than North American jurisdictions (with the exception of southern Alberta, Table 5). This should also be reflected in the annual harvest levels, as high reproduction/recruitment allows for a higher sustainable annual harvest of the moose population. This is evident in the fact that Sweden, Norway, and Finland together harvested more moose than all other reporting jurisdictions combined (120,000 vs. approximately 70,000). Low reproductive rates can have multiple causes, one of which is proximity to the carrying capacity of the area. However, reproductive rates are only one of many factors in moose harvest rates. There are stark contrasts to the method in which moose are hunted in North America vs. Scandinavia. In North America, hunting regulations are typically set by a state or provincial governing body and general harvest practices fall within the North American Model of Wildlife Conservation (Organ et al. 2012). Practices that are much more common in Scandinavian countries, such as party hunting, use of dogs, and preferential selection for calves are rarely practiced in North American and in some jurisdictions, prohibited (e.g. use of dogs), which may result in higher harvest success rates in Scandinavia (Lavsund et al., 2003).
Our work highlighted the increasing negative impacts of climate change on moose through mediation of habitat change (Teitelbaum et al., 2021) and parasite prevalence (Debow et al., 2021; DeCesare et al., 2024). However, a more focused survey than ours would have yielded a more detailed understanding of the severity, frequency and variation of climate change impacts across moose jurisdictions. Future work would benefit from a more focused questionnaire that would assess regional commonalities and differences, highlighting areas where collaborative research and management would be helpful. Additionally, conducting surveys at a more regular interval (e.g. every 5 years) would increase participation and data sharing for a species that largely transcends political boundaries. Compilation of information related to moose populations and their management would be simplified and made more reliable if reporting were standardized to a more uniform format. Transitioning away from a population estimate towards a density-based comparison may account for spatial disparities between jurisdictions (e.g., Alaska vs. Vermont), but it too is not without flaws. To properly compare densities, managers must be able to account for non-suitable habitat in any density estimate. Alternatively, focusing on population trend, trajectory and percent change over time may be more comparable across jurisdictions, but these metrics rely on accurate population estimates that occur every 3−5 years, which may not be possible due to population scope or financial burden. A future challenge for moose researchers and managers worldwide is to establish both regular and standardized reporting of moose population status.
ACKNOWLEDGEMENTS
We thank all the participants who filled out our survey (Supplementary Table 2). Special thanks to W. Jensen, R. Rea, A. Rodgers, E. Bergman and S. Windels who provided additional data and/or input on survey design. Funding was provided by Federal Aid in Wildlife Restoration Grants W-173-G and Project W-67-R-57. Special thanks to the New York Department of Environmental Conservation and North Dakota Game and Fish Department who administered the grants.
_in_europe_(a)_and_north_ameri.png)
_in_europe_(a)_and_north_america_.png)
_in_europe_(a)_and_north_.png)
_exhibit_some_form_of_mig.png)
_is_hunted_in_europe_(a)_.png)
_hunted_in_eu.png)
__black_bears_(*ursus_am.png)
_in_europe_(a)_and_t.png)