

It is well established that the nutritional condition of ungulates can impact survival (Bender et al., 2008; R. C. Cook et al., 2021) and fecundity (Keech et al., 2000; Testa, 2004; Testa & Adams, 1998), linking bottom-up resource conditions to population dynamics (Bertram & Vivion, 2002; Franzmann & Schwartz, 1985; Stephenson et al., 2020). In ungulates, body fat integrates the balance between energy intake and expenditure and thus serves as a gold standard of assessing the nutritional condition of individuals (J. G. Cook et al., 2004; Monteith et al., 2014; Parker et al., 2009). Stephenson et al. (1998) pioneered efforts to quantify body fat of live animals in the wild, using ultrasonography to measure fat thickness in the rump area of moose (Alces alces). They used captive moose to develop regression equations linking rump fat thickness to total body fat stores in moose carcasses. Updates to Stephenson et al.'s (1998) methodology have since included adjustment to fat measurements according to animal body mass (R. C. Cook et al., 2010), and incorporation of palpation-based body condition scoring to estimate body fat when no rump fat is present (Levine et al., 2022). Measurement of rump fat and (in some cases) extrapolation to total body fat using ultrasonography has since been applied in many moose studies where nutritional condition was of interest relative to other components of behavior or population dynamics (R. C. Cook et al., 2021; DelGiudice et al., 2011; Jesmer et al., 2017; May et al., 2026; Newby & DeCesare, 2020; Ruprecht et al., 2016; White et al., 2014). However, because rump fat measurements using ultrasonography require capturing and handling animals, costs and logistical challenges preclude managers from commonly acquiring such data except where targeted research efforts are underway.
Gingras et al. (2014) showed that general indications of body condition of moose on a regional level could be obtained from hunter-killed animals through the collection of physiological measurements by management agency staff. Among other metrics, Gingras et al. (2014) inferred subcutaneous fat reserves by making incisions at two locations of the carcass (5 and 10 cm from the base of the tail at a 45˚ angle from the vertebral column) and measuring mean fat depth at both. This approach requires an investment of staff time as well as incentives or requirements for hunters to present carcasses for physical inspection, which may limit its application in some jurisdictions. Similar measurements of fat deposits in the rump, sternum, or kidneys have been collected for other ungulates where access to staff time and hunter-submitted animals or organs were achievable (Anderson et al., 1972; Austin, 1984; Mattiello et al., 2009; Serrano et al., 2008).
We conducted a pilot study investigating whether hunter-collected data could be useful in understanding broad-scale patterns of body condition in harvested moose populations within Montana. We first quantified voluntary hunter participation in a self-collected data program, and used clear and simple instructions to maximize hunter participation while minimizing observation error that can hinder citizen-science approaches (Clare et al., 2019). We lacked validation data to quantify error or bias in these data but instead asked a series of a priori questions to explore if underlying data patterns matched biological expectation. Specifically, we asked the following 4 questions of these data:
-
Does adult male rump fat decline during the rut? Male ungulates, including moose (Cederlund et al., 1989) are known to lose fat with high energy expenditure during the rutting season (Forsyth et al., 2005; Li et al., 2025). Moose hunting seasons began on 15 September each year and continued for a roughly 10-week period containing the rutting period and lasting until an end date in late November or early December (end date range: 25 November – 1 December). Thus, we expected that a decline in rump fat measurements over time should be evident in hunter-collected fat measurements because of the overlap between rutting and our study period.
-
Does adult female rump fat show less sensitivity to the rut? Because adult female ungulates do not experience the same degree of energetic costs during the rut, we would not expect steep reductions in rump fat among female moose during the study period akin to that for males (Cederlund et al., 1989; Gingras et al., 2014; Simard et al., 2014).
-
Is there spatial autocorrelation at regional scales? Ecosystem heterogeneity includes autocorrelation at broad spatial scales (Koenig, 1999). This includes a broad-scale spatial pattern in nutritional resources (McCarley et al., 2020) that is predictive of corresponding nutritional condition of ungulates (Merems et al., 2020; Proffitt et al., 2016). In Montana, moose broadly occupy all of the generally mountainous terrain of western Montana, as well as portions of central and eastern Montana where island mountain ranges or river bottoms provide suitable habitat. Vegetative associations vary across the state, from predominately dense, mesic conifer forests in northwest Montana to higher availability of expansive willow-riparian habitats in southwest Montana. In accordance with these broad patterns, we tested the hypothesis that male rump fat (as measured by responding hunters) was spatially autocorrelated within the distribution of moose in Montana.
-
Are spatiotemporal patterns in rump fat correlated to that of antler spread? The relative size of antlers among populations of cervids can reflect regional differences in nutritional composition of forage, accrued over multi-generational time periods (Michel et al., 2016; Monteith et al., 2009). We hypothesized that broad-scale differences in rump fat should correlate with antler size for male moose at broad scales of space and time.
Ultimately, our goals were to understand and quantify the logistical and scientific potential for recruiting hunters as citizen-scientists to monitor an important but often cost-prohibitive metric of ungulate population health.
Methods
Hunter-based data collection
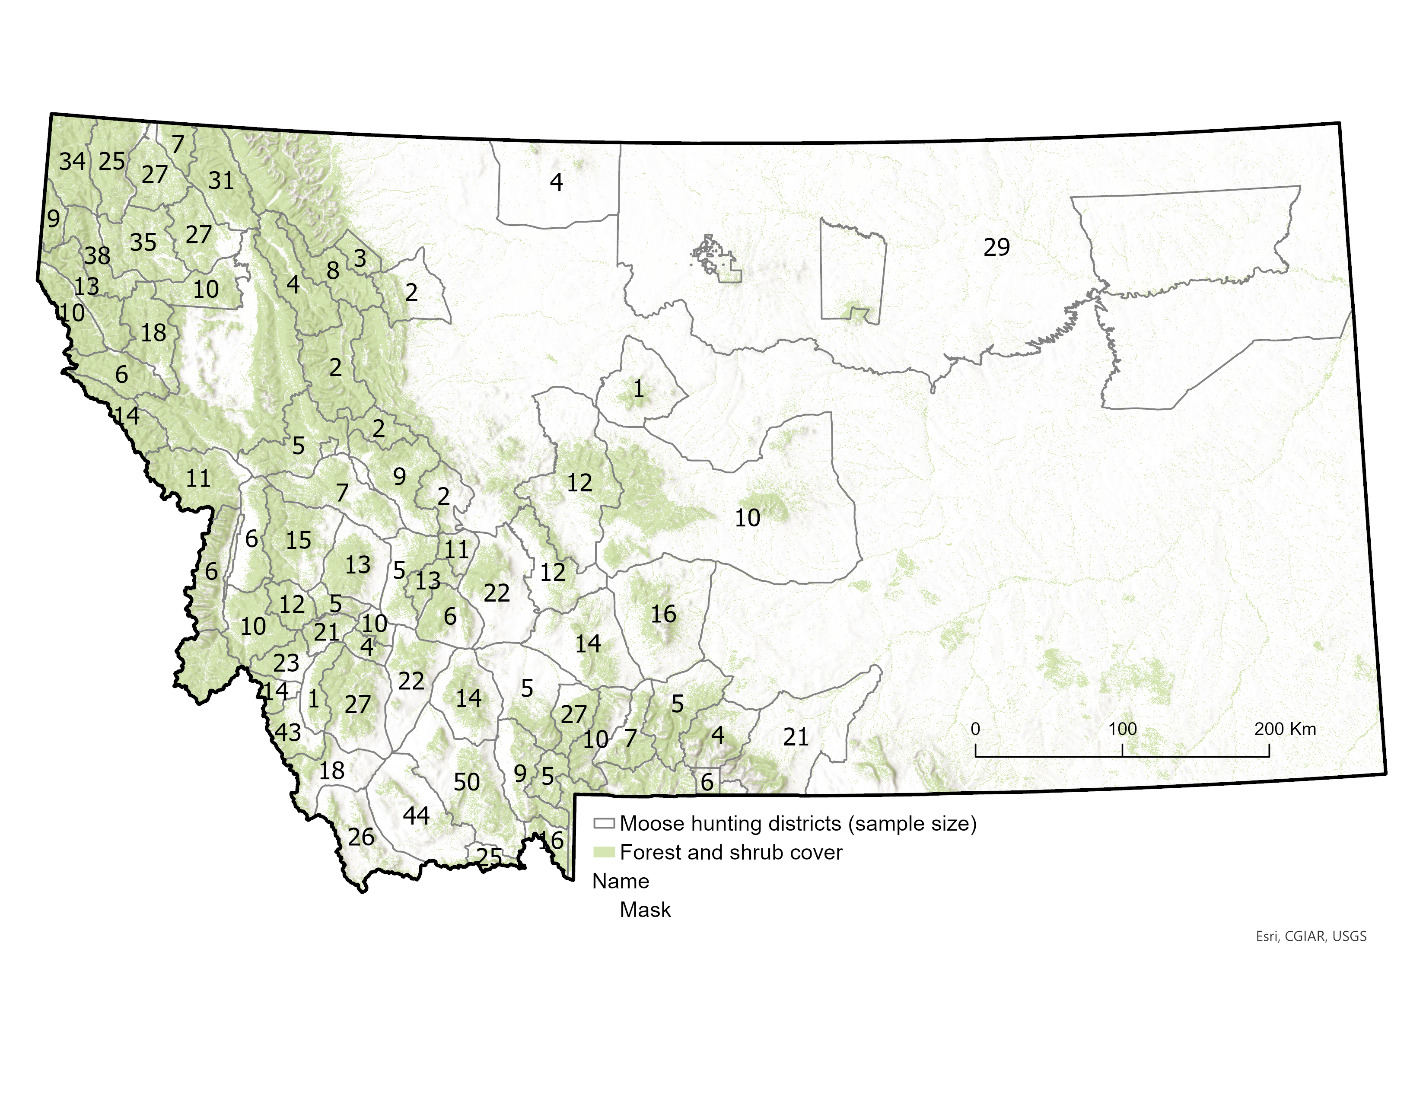
During our 2013–2022 study period, moose hunting in Montana was managed by a limited-entry system of lottery-allocated licenses that permitted hunting within a range of 68–79 hunting districts across the state per year (Figure 1). A total of 320–365 licenses were issued annually, of which an average of 79% were designated for harvest of antlered bull moose, 15% for antlerless moose, and 6% for any moose. All licenses permitted hunting by either rifle or archery across the entire season, which opened September 15th of each year and closed in late November or early December (range: 25 November–1 December). Behavioral observations of rutting activity of moose suggested the primary rutting season in Montana spanned a roughly 3- to 4-week period centered around a peak of 2 October each year (DeCesare et al. 2024). Thus, the data collection period spanned a hunting season of 72–78 days, as well as periods prior to, during, and following the primary rutting period of moose in this region.
Because moose hunting in the state of Montana is conducted by lottery-allocated licenses, we had access to names and addresses of all moose hunters. During the 2013–2022 hunting seasons, we sent letters and sampling materials on behalf of Montana Fish, Wildlife and Parks (MFWP) to all moose license-holders, requesting their voluntary participation in collection of data and samples from their hunt. From each hunter, we requested an incisor tooth for ageing via cementum analysis (Matson’s Laboratory, Milltown, MT, USA), information on the date and location of kill, and measurement of maximum outside antler spread for males (distance between antlers at widest point and measured in a straight line at a right angle to the center line of the skull). For moose, the spread of antlers is highly correlated with overall antler size (r = 0.922; Gasaway et al., 1987) and deemed the single best index of antler size (Bowyer et al., 2001).
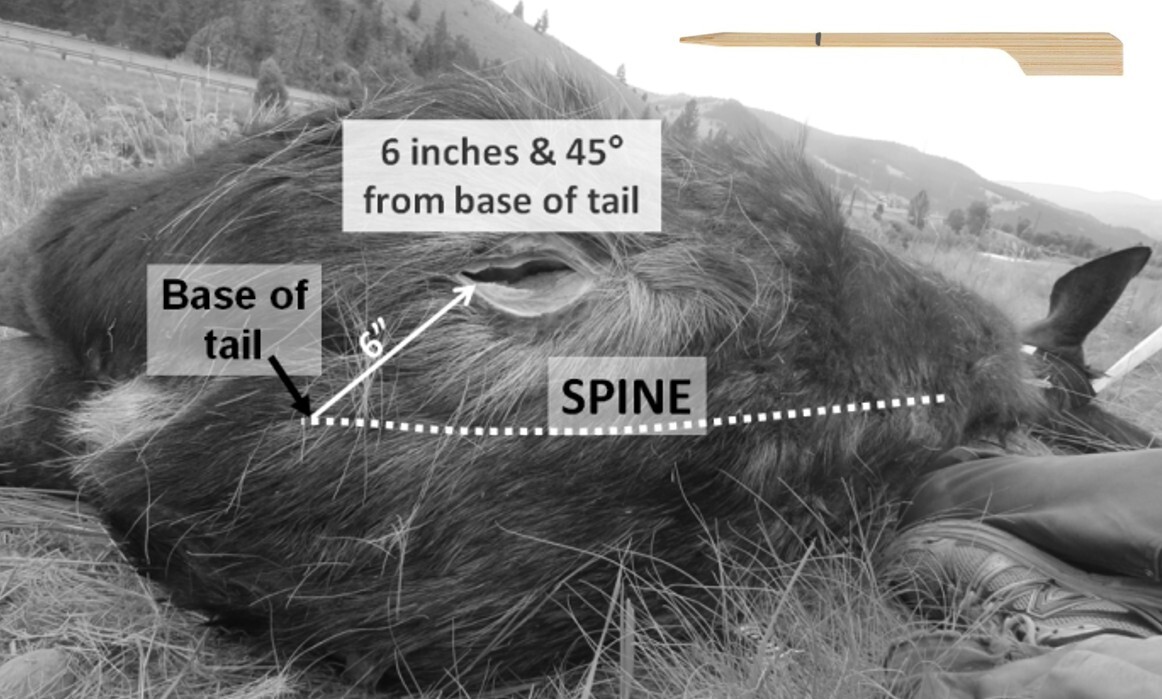
Lastly, we asked hunters to mark rump fat depth on a 7.7 cm paddle-style bamboo toothpick. Stephenson et al. (1998) established the correlation between total body fat and measurement of the maximum depth of rump fat along a transect between the spine, at its closest point to the coxal tuberosity, and the ischial tuberosity. Our field observations of fat depth along this transect indicated that maximum depths were typically found in a consistent section of that transect. Thus, we simplified this metric for hunters and requested that they measure fat in a single, standardized location. Specifically, hunters were requested to make a single incision on the rump of the moose 15cm (i.e., 6") from the base of the tail and at a 45˚angle from the spinal column (Figure 2) and to mark (with provided pencil) the thickness of the fat layer (if any) between the hide and muscle. Hunters were further instructed to return the toothpick to us along with the data card and other samples in a return envelope that was self-addressed and postage paid. If no fat was evident, hunters were instructed to indicate that on the data card. Measurements of toothpick markings (to 0.1 mm) were then conducted by a single MFWP biologist using a digital caliper.

Data analysis
We measured hunter participation rate as the number hunters that provided a fat measurement relative to the estimated number of hunters that successfully harvested a moose. In Montana, moose hunter success rates averaged 78% prior to this study (DeCesare et al., 2014), indicating that not all license-holders are able to provide a fat measurement from a harvested animal, even if willing to do so. To estimate the total number of successful moose hunters each year, we queried annual harvest estimates from MFWP’s annual harvest survey program (DeCesare et al., 2016). This program included repeated phone calls to all moose license-holders to record if hunters successfully harvested moose and statistical corrections for non-response bias (Lukacs et al., 2011). For moose specifically, harvest survey response rates ranged from 81 to 96%, and statistical estimates of annual total harvest had coefficients of variation of 0.6–2.3% (DeCesare et al., 2014). We summarized participation rates according to year, administrative region, and pooled statewide across the entire study period.
Although rump fat has a linear relationship with body fat when present (Stephenson et al., 1998), animals with zero measurable rump fat can result from total body fat percentages ranging from <1 to ~5.6% (R. C. Cook et al., 2010, 2021; Levine et al., 2022). Thus, values of zero rump fat depth represent a threshold below which additional variation in body fat or nutritional condition is left-censored (Helsel, 1990; McDonald & Moffitt, 1980). In other words, additional variation in body fat amongst sampled animals with rump fat depths of zero is not adequately captured with this metric. Although we were ultimately interested in understanding body fat, our metric was constrained in its ability to distinguish amongst animals with no measurable rump fat. Thus, we used Tobit regression (Tobin, 1958), to explore these data while accounting for the left-censoring pattern of fat measurements at a threshold of 0 rump fat depth (McDonald & Moffitt, 1980). Tobit regression makes use of the full data (including 0s) but fits the model while accounting for unmeasured, additional variation in the response (here, overall nutritional condition) that is not measured below a value of 0 rump fat. We applied Tobit regression to rump fat depth measurements, left-censored at a minimum value of 0, in program R 4.2.2 (R Core Team, 2021) using the package censReg (Henningsen, 2024) to develop and compare Tobit models, and the package AER (Kleiber & Zeileis, 2008) to extract residuals.
We hypothesized that initial fat depth and its depletion over time among males may vary with antler size according to different energetic costs of young vs. mature individuals (Simard et al., 2014). We tested for these effects by including a main effect of antler spread on fat depth, as well as the interaction of spread and date. Our full model for adult males was:
Tobit(Rump fat depth) = β0 + β1(Julian day) + β2(Maximum antler spread)
+ β3(Julian day Maximum antler spread).
We evaluated support for models and reduced alternatives using a combination of Akaike information criteria (AICc) and significance tests (Arnold, 2010).
We applied the same Tobit regression models with female data, relating Julian date to adult female rump fat in both linear and exponential forms. However, for females we hypothesized statistical support for an intercept-only model, i.e., a much weaker effect of time on rump fat levels during the autumn study period.
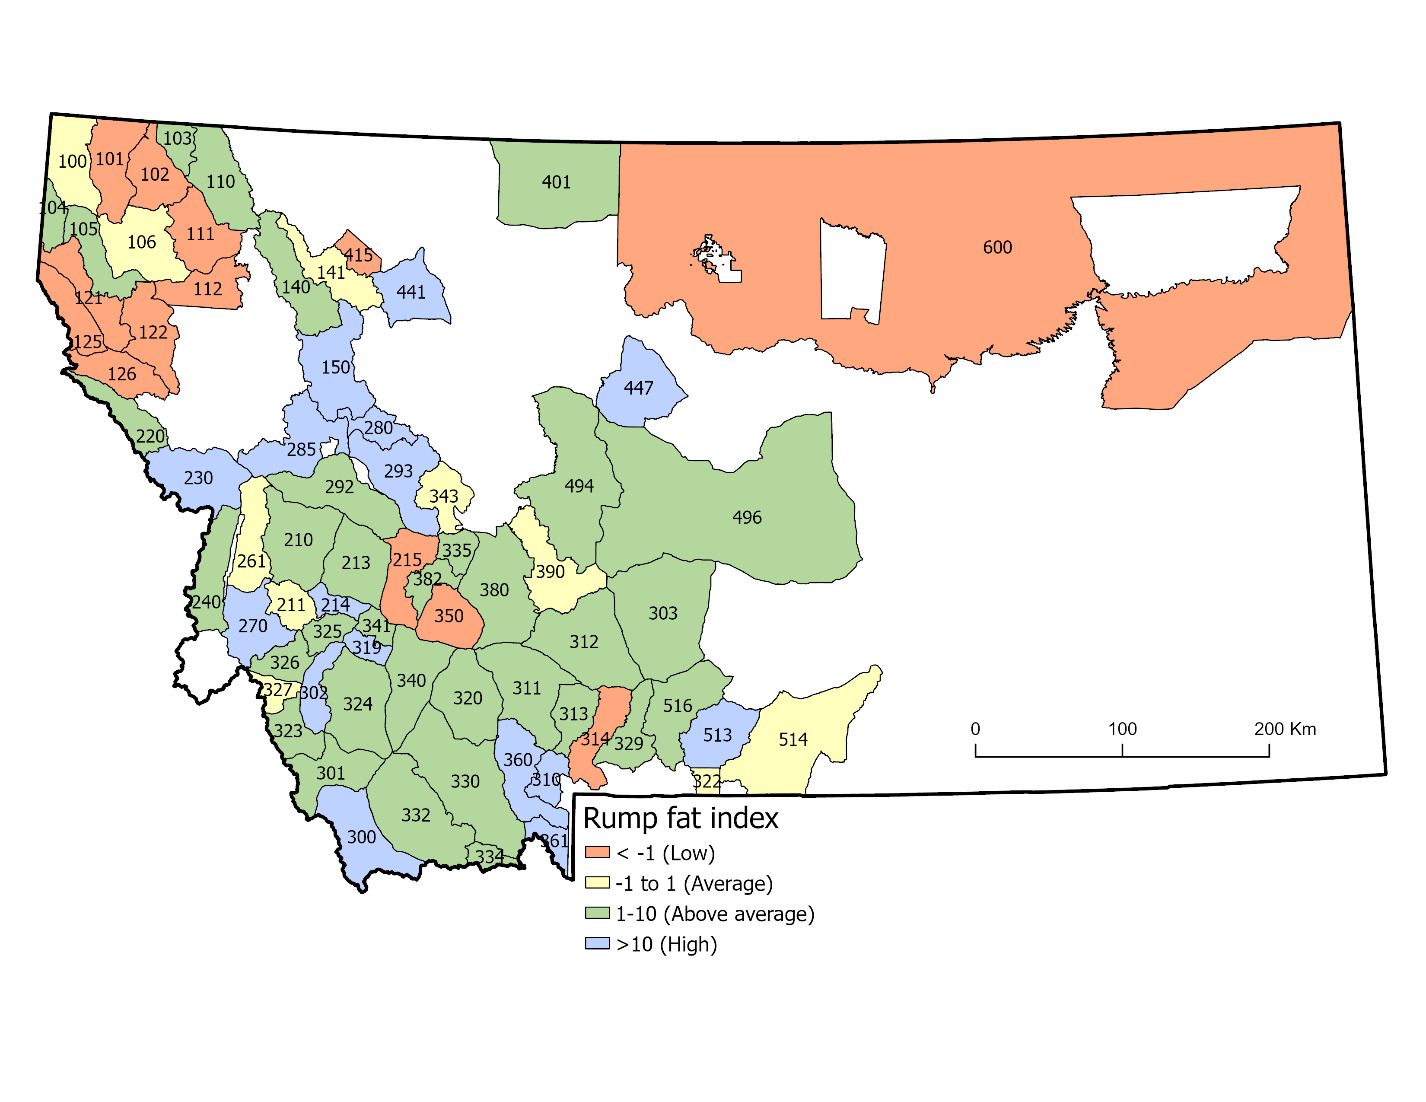
We evaluated spatial autocorrelation after first controlling for the effects of time and age (i.e., antler spread) on rump fat data. We first applied the Tobit model described above and retained the modeled residuals of each sample to quantify unexplained variation in male rump fat. We treated these residuals as a “rump fat index” for future analyses. We then estimated Moran’s I as a test of spatial autocorrelation among rump fat index measurements per hunting district (HDs). We pooled data across years, estimated means of the rump fat index per HD, and used centroid coordinates for each HD to characterize their spatial location. We estimated Moran’s I using the ape (Analyses of Phylogenetics and Evolution) package in program R (Gittleman & Kot, 1990). To complement this test statistic, we also mapped mean rump fat index patterns by HD to visually assess spatial pattern.
Lastly, we developed an HD-scale antler growth index, similar to that for rump fat, while controlling for the effect of animal age. Specifically, we first estimated the statewide mean antler spread specific to each year of age among samples. We then calculated the antler growth index for each sample using the residuals from the mean (i.e., difference between the spread of each harvested moose and its age-specific mean). We averaged antler growth index values within each HD across the full study period, and used simple linear regression to assess the evidence that our rump fat index explained variation in antler growth per HD.
Results
We received responses with usable data on fat depth from 1,248 hunter-killed moose (1,114 males, 134 females) during the 10-year period 2013–2022. Over that same period, an estimated 2,547 moose were harvested by 3,509 license-holders (mean success rate = 73%). In total, this yielded an estimated voluntary participation rate of 49% of successful hunters providing useable fat depth information. However, some of these hunters neglected to include other attribute data that was used to calibrate fat measurements, including antler spreads for males or dates of kill. When accounting for these missing data, we had complete data for 1,171 moose (1,041 males, 130 females), and a complete-sample participation rate of 33% of tag-holders and 46% of successful hunters. Across all samples, raw (non-zero) rump fat depth averaged 23.7 mm (SD = 15.4) among males and 20.8 mm (SD = 12.6 mm) among females.
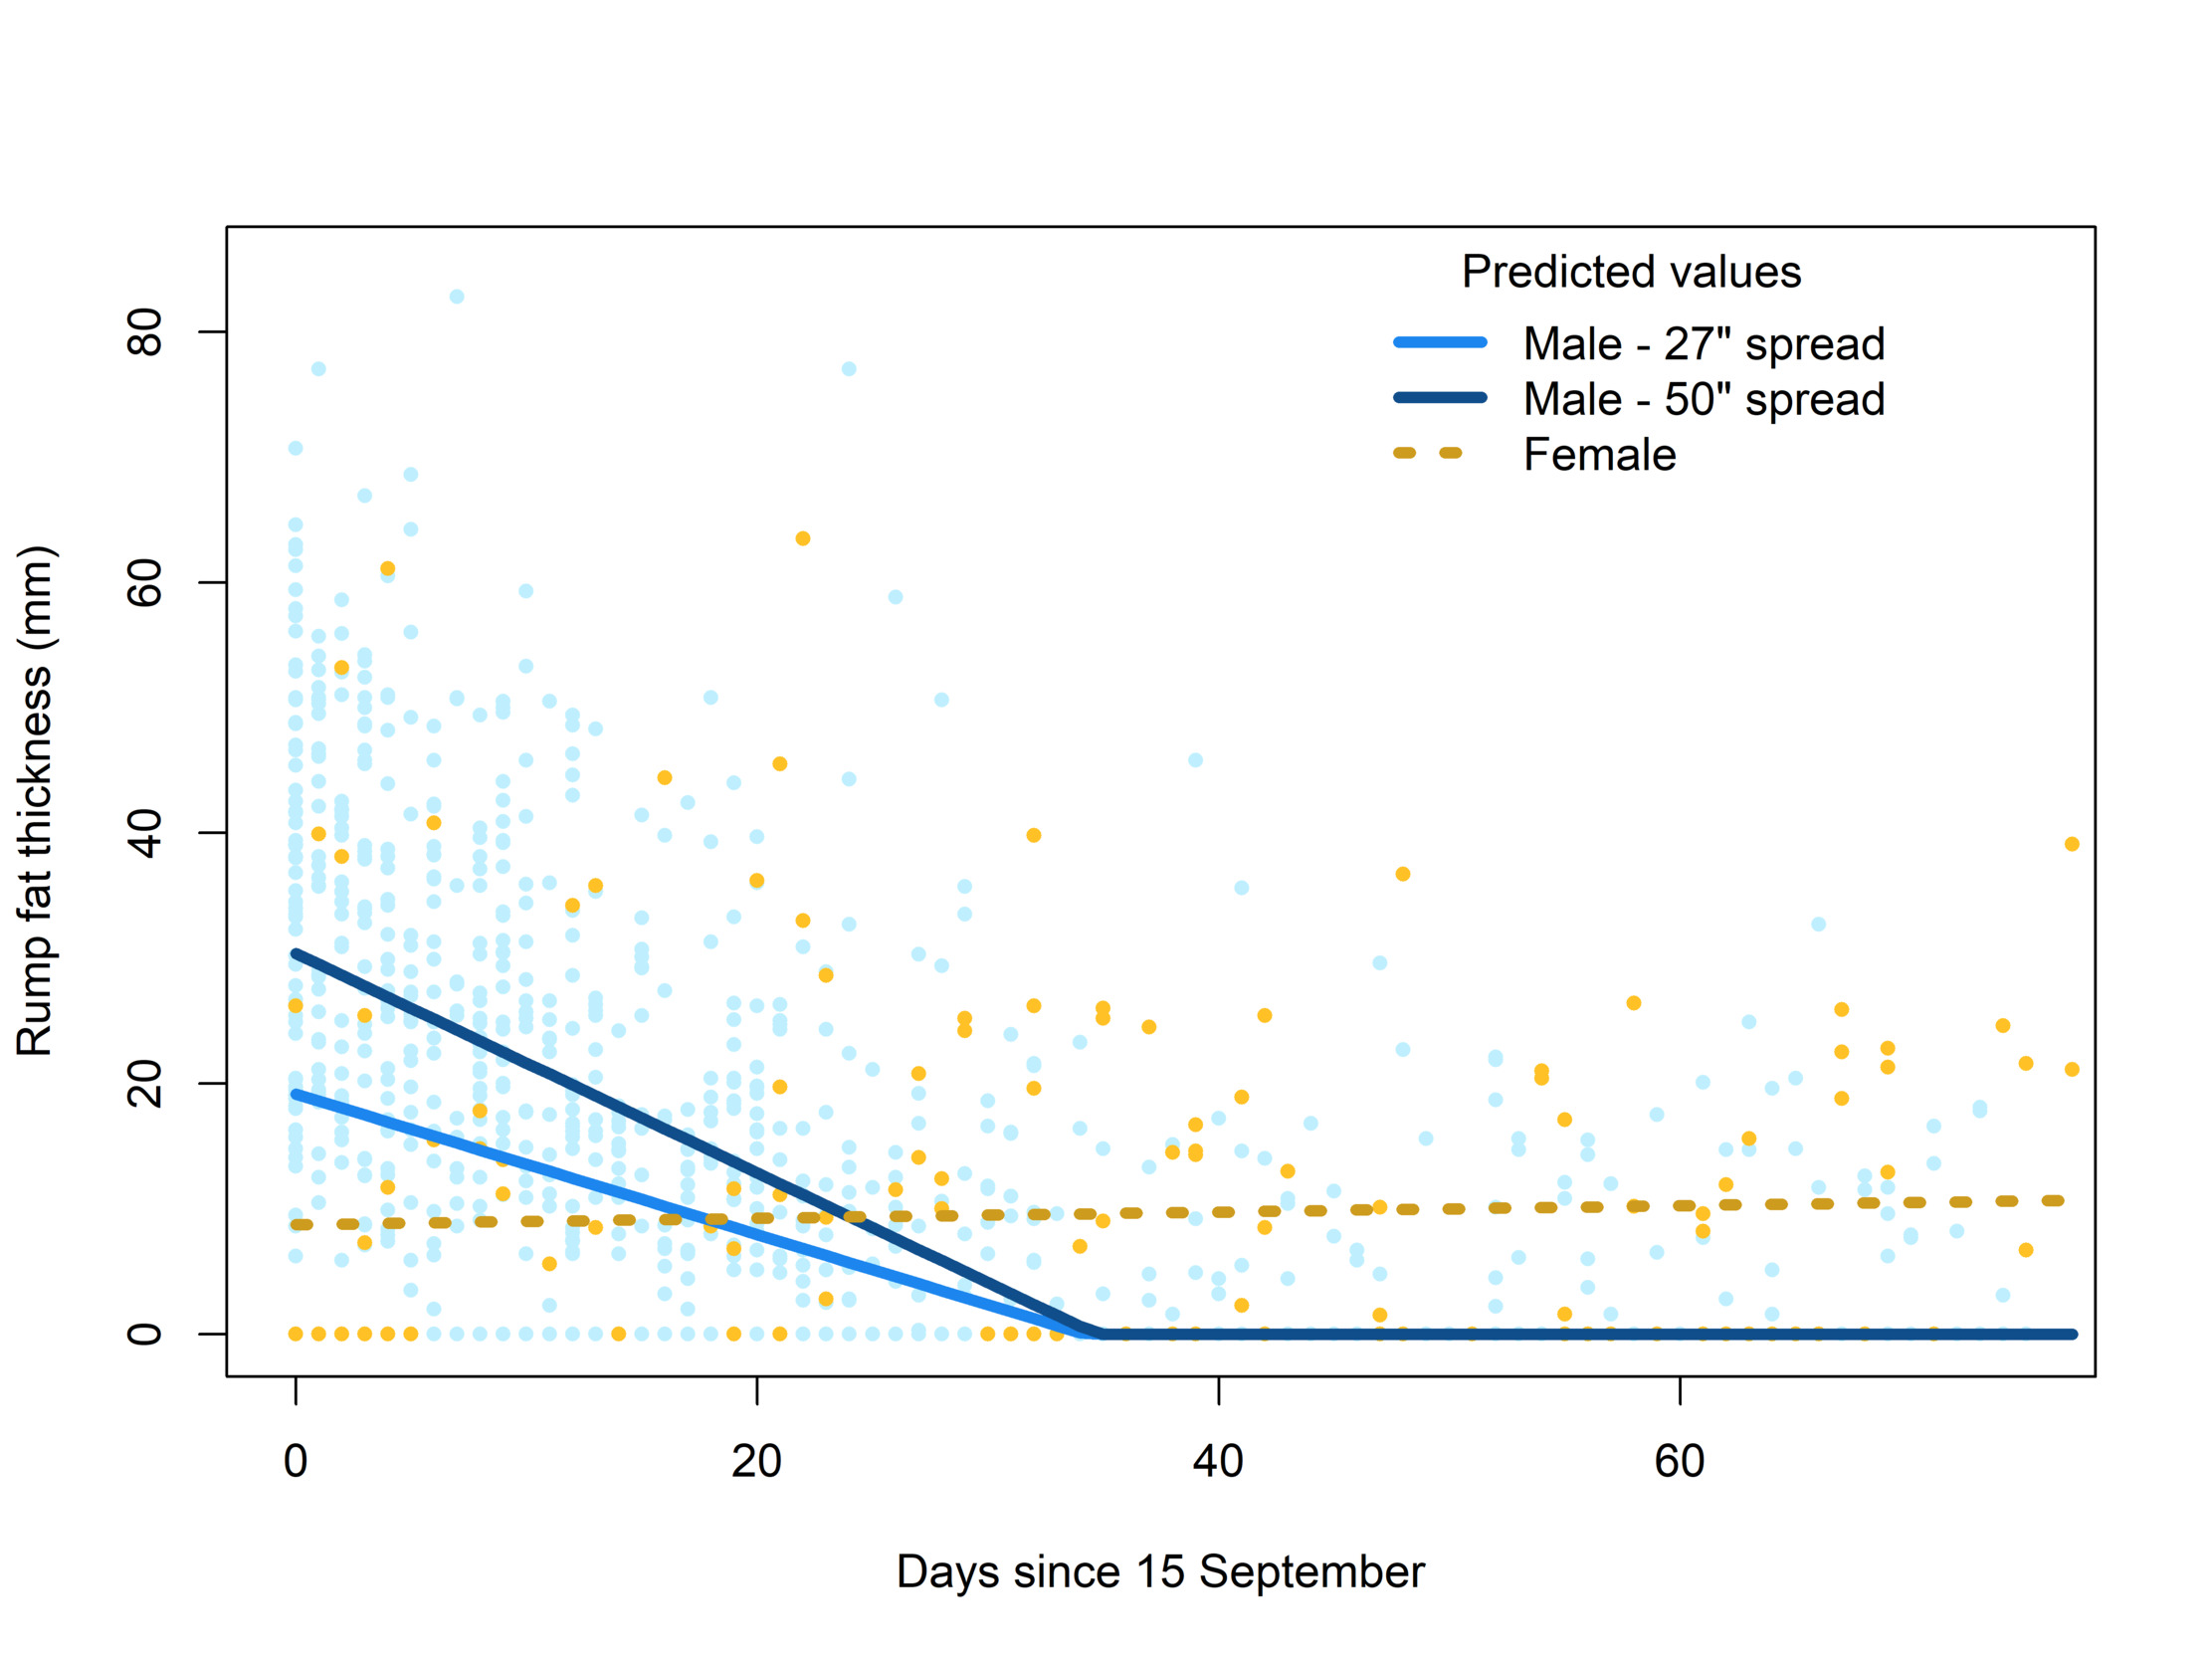
Although there was much variation, we found a significant and consistent loss in rump fat thickness over the course of each hunting season among bull moose, and an interaction with antler spread (Table 1). Predictions of the Tobit regression model for a relatively small bull (27" spread; 5th percentile of data) and a relatively large bull (50" spread; 95th percentile of data) indicated that large-antlered moose started the season with more fat but lost it at a faster rate (0.88 mm/day) than small-antlered bulls (0.56 mm/day; Figure 3). Interestingly, predicted fat thickness for small and large bulls at those antler sizes reached complete depletion of rump fat levels on the same day, 20 October, of each year (Figure 3). Females, on average, started with lower fat reserves than males but did not exhibit the same energetic costs during the rutting season, showing no effect of date on rump fat measurements during this period (β = 0.025, SE = 0.071, P = 0.72; Figure 3).
Using the residuals from the top model to estimate a rump fat index, we found significant evidence of spatial autocorrelation among HDs across Montana (Iobs = 0.035, Iexp = -0.014, P = 0.003). Visual examination of mean rump fat index values corroborated this result (Figure 4). Lastly, rump fat index values were not predictive of mean antler growth at the HD-scale (β = -0.01, SE = 0.049, P = 0.841, R2 = 0.0006).
_and_predicted_(lines)_rump_fat_thickness_(mm)_according_to_day_of_the_hunt.png)
Discussion
An index of nutritional condition among moose populations obtainable from hunter-collected data would potentially offer managers a rich source of inexpensive data. It would require neither dedicated research efforts nor staffing of inspection stations throughout the hunting season, and only a basic system for identifying and communicating with targeted hunters. In our case, costs were limited to some very basic supplies (bamboo toothpicks, padded envelopes) and two-way shipping, averaging $2–3 per sampling kit. Previous work in Montana has highlighted the challenge of monitoring habitat condition with detailed vegetation work such as browse surveys of willow (Salix spp.) (Burkholder et al., 2017). Instead, the nutritional condition of animals can be logistically easier to collect, and would integrate the combined effects of forage input and energetic costs when seeking a metric to monitor the nutritional status of populations (Bowyer et al., 2020; Monteith et al., 2014).
Our results corroborated those of others who have similarly relied on hunters to collect ecological data that would be cost-prohibitive if collected only by agency staff (DeCesare et al., 2023; McGraw et al., 2022). When specifically targeting information regarding the nutritional condition of ungulates, prior studies have typically relied on hunters to provide access to biological samples that are then collected, processed, and recorded by trained staff (Anderson et al., 1972; Austin, 1984; Gingras et al., 2014; Mattiello et al., 2009; Serrano et al., 2008). However, our work supports the recent study by McGraw et al. (2022), showing that efforts to incentivize and simplify requests of hunters can yield impressive participation rates and useful data while expanding geographic scope and reducing staff time commitments.
Although the body condition of adult females has been primarily emphasized as a key metric of ungulate population dynamics (Monteith et al., 2014), significantly fewer female moose are harvested in Montana than males; as well, valid interpretation of female-specific measurements requires knowing lactation status (Bergman et al., 2018; R. C. Cook et al., 2013). Metrics targeting adult males do not suffer from that additional source of variation, but may include others. Male body fat typically declines during the breeding season (Cederlund et al., 1989; Stephenson et al., 1993), which often coincides with hunting season and introduces an undesirable source of variation. Our success in accounting for this via Tobit regression analysis may offer a solution. Additionally, measuring body fat during the fall hunting season (well before the timing when most moose are captured and handled for research purposes) illuminates heterogeneity in body condition that is often obscured in winter when body condition of ungulates living in northern or temperate climates typically converges toward lower levels regardless of their nutritional plane (R. C. Cook et al., 2013; May et al., 2026; Monteith et al., 2013).
Our results suggest that the approach detailed here could yield information regarding variation in the nutritional plane of ungulate populations over space or time. That said, we must still advise caution when interpreting these data. We could not validate hunter-collected fat measurements to ensure that they were accurate and unbiased. Furthermore, there may be additional sources of variation (e.g., measurement locations, time elapsed between death and measurement) that would generate additional sampling variation or noise to such data beyond what might be expected in more controlled research settings. Paired collection of data by both citizen scientists and trained biologists to assess or calibrate data may be a necessary step in establishing long-term protocols (e.g., Swanson et al., 2016)
There may also be additional sources of biological variation in such data that confound interpretations specific to regional variation in forage quality alone (R. C. Cook et al., 2013). For example, it is possible that the general pattern of lower fat levels observed in northwest and northeast Montana (Figure 4) could be driven by factors other than forage quality, such as differences in the quantity of forage, spatial arrangement of forage resources, or energetic costs of accessing such forage as dictated by movement behaviors (Moen et al., 1997; Vincenot et al., 2015). Spatial dispersion or densities of females, being social resources that dictate movements of males during the rutting season (sensu Ricci et al., 2024), could also explain differences in fat levels of males, if energetic costs vary regionally according to the ability to locate and travel amongst females. Lastly, other biological phenomena related to the health of moose such as parasitism or climate (DeCesare et al. 2024) could also induce variation in body condition that might confound interpretation specific to forage quality. Where research or management interests concerning the nutritional condition of ungulates coincide with access to hunter participation in data collection, we recommend this as one possible approach to gain useful and low-cost data. Furthermore, participation in citizen science can have other benefits regarding public engagement in research stewardship (Dickinson et al., 2012).
ACKNOWLEDGEMENTS
This work was part of a moose research program funded by the auction sale of 1 Montana moose hunting license per year, matched with United States Fish and Wildlife Grant-in-Aid W-157-R. We also thank the Safari Club International Foundation for 2 Conservation Grants to support this research. M. Becker, K. Carson, J. Newby, C. Peterson, J. Ramsey and many other biologists helped with data collection for this project. We thank M. Carstensen and two anonymous reviewers for their helpful reviews of this manuscript.