Monitoring moose population abundance and trend is one of the primary tools wildlife managers use to manage free-ranging moose (Alces alces) populations (Kramer & Kalén, 2025; Moll et al., 2022). The ability to monitor the status and trajectory of a population is essential in jurisdictions where moose harvest is regulated through annual tag allocations and managers can increase or decrease the number of tags issued based on perceived changes in population status (Boyce et al., 2012; Lavsund et al., 2003; Luymes et al., 2024). More recently, concern over the impacts that parasites and disease may have on moose populations has increased the importance of more focused and regular population monitoring (Grauer et al., 2025; Kramer & Kalén, 2025; Pekins, 2020). The suite of approaches currently employed by wildlife managers to monitor the status of moose populations includes tracking individuals over time through GPS-tracking (Global Positioning System) collars or ear-tagging, camera monitoring, hunter harvest, and aerial surveys (Moll et al., 2022).
Aerial surveys have become one of the more commonly used monitoring methods for monitoring moose, because they can assess population abundance, distribution and demographics through one sampling method (Abouelezz & Hobbs, 2025; Gasaway et al., 1986; Moll et al., 2022; Sovie et al., 2023). Aerial surveys also allow for flexibility in sampling scale when coupled with statistical modeling tools such as distance sampling (Miller et al., 2019) and density surface modeling (Maćkiewicz & Ratajczak, 1993), while allowing a sampling scale that best fits their management objectives (i.e., local vs. regional population estimates). However, the methodology is not without drawbacks. Conducting aerial surveys has both a high financial and staffing cost, where many jurisdictions require contracted aircraft (helicopter or fixed-wing) and pilots, and provide staff observers. Additionally, non-state variation can lead to heterogeneous detection rates by impacting observer visibility. Local habitat conditions (such as canopy composition or terrain ruggedness) can reduce the likelihood of detection, daily weather conditions can influence visibility via fog or cloud cover, and the presence or absence of snow cover can significantly impact observer detection rates (Andreozzi et al., 2016; Hinton et al., 2022).
Estimating abundance accurately from aerial surveys requires modeling a function to account for imperfect detection (Moll et al., 2022; Timmerman, 1993). Common covariates include the composition and structure of the habitat (Hinton et al., 2022; Oyster et al., 2018; Sovie et al., 2023), distance (Peters et al., 2014), group size (Kantar & Cumberland, 2013; Sovie et al., 2023), snow cover (Hinton et al., 2022; Wald & Nielson, 2014), and a measure of observer fatigue (LeResche & Rausch, 1974). Although it is important to develop a detection function that adequately explains the observed variation, each additional covariate in a model can begin to influence the ability for managers to make inference using known biological information (Giudice et al., 2012). Additionally, overly complex detection functions can become a problem when the signal-to-noise ratio declines past some (usually undefined) point, or when investigators cannot adequately sample the underlying covariate hyperspace relevant to the process.
Moose were historically present in New York long before European colonization, with archeological records suggesting that moose have been present north of the Mohawk River since the Pleistocene Epoch. The extirpation of moose in the state corresponded with the expansion of European settlements and intensive resource extraction in the late 19th century, primarily unregulated timber harvest and market hunting. Moose were believed to be extirpated from New York as early as the 1860’s (Fischer, 1955; Ritchie, 1969; Ritchie & Funk, 1973). The first recorded evidence of permanent residence since the 1860’s was in the mid-1980’s, when Department of Environmental Conservation (DEC) biologists estimated that 6 to 11 moose resided within the Adirondack Park (Hicks, 1986; Hicks & McGowan, 1992). The DEC determined that a moose population was securely established and was believed to be permanent by 1998 (A. Hicks, New York Department of Environmental Conservation Personal Communication, 2016). This belief was driven by a steady increase in public sightings, data from moose−vehicle collisions, and periodic aerial surveys. New York’s moose population was believed to have increased from under 100 in the late 1980s to over 200 by the late 1990s, and to double again to 400 by the 2000s (Garner & Porter, 1990; Hicks, 2002; Hicks & McGowan, 1992). Initially, aerial surveys conducted in New York used stratified random sampling (Hinton et al., 2022) but later transitioned to repeated block sampling due to the difficulty of collecting the number of independent moose sightings (n = 60-80) required to develop a robust detection function. The latter approach relied on principal component analysis (Maćkiewicz & Ratajczak, 1993) and density surface modeling (Miller et al., 2021) to develop parkwide population estimates for moose in the Adirondack Park. The initial detection function was developed using covariates habitat type, observer fatigue, moose group size, and air temperature. Following the development of the detection function, 3 principal components were developed from different weighted linear model combinations of habitat and environmental covariates (i.e., agriculture, developed, forest, shrub, timber, wetland, water, elevation, and number of days with snow cover) to extrapolate across unsampled blocks of the Adirondack Park using density surface modeling (Hinton et al., 2022).
Although the population estimates provided by Hinton et al. (2022) helped wildlife managers to evaluate the status and trend of the moose population, their results lacked the desired precision (<25%) to monitor population change over time through intermittent surveys. Here, we sought to estimate the abundance of moose in the core area of New York’s Adirondack Park with high precision, which we hoped would serve as an assessment of the statewide population status, and thus reduce the need for annual large-scale surveys to monitor population trends.
STUDY AREA
We conducted aerial surveys for moose for 5 years (2018−2020, 2024−2025) in Adirondack Park (hereafter known as Park), located in northern New York. The Park covered approximately 24,280 km2 and consisted of a patchwork matrix of public (~61%) and private lands that is a transitional zone between of northern hardwood (e.g. sugar maple [Acer saccharum], red maple [Acer rubrum], yellow birch [Betula alleghaniensis], American beech [Fagus grandifolia], eastern hemlock [Tsuga canadensis]) and boreal forest (e.g. balsam fir [Abies balsamea], red spruce [Picea rubens], eastern white pine [Pinus strobus]; Peterson et al., 2020). Parkwide elevations vary from 30-1,600 m. Mean winter temperatures ranged from -12 to -6º C, and average annual snowfall was 1.5-3.6 m (Jenkins & Keal, 2004).
Public lands within the Park boundary could not be leased, sold, or exchanged to any other private or public corporation, nor could the timber thereon be sold, removed, or destroyed, as formalized by the Forever Wild clause of the New York State Constitution (N.Y. Const. art. XIV, § 1). Therefore, 85-90% of the public lands surveyed were mature forested stands. However, resource extraction was allowed on privately owned portions of the park, resulting in patches of uneven-aged forests commonly harvested through either single-tree selection or shelterwood harvest regimes (Kramer et al., 2022).
Within the Park, we identified a core area of moose range using public sightings (unpublished data), GPS collared moose (Kramer et al., 2024), and previously identified higher-density pockets (Hinton et al., 2022). The forest composition within the core area was similar to the surrounding park, however a significantly higher portion of the forest was subjected to commercial timber treatments. Approximately 75% of the core area landscape was forested with 15% of the landscape exposed to commercial timber harvest within the past 15 years. Deciduous hardwoods species were the dominant forest type (48%) with an interspersion of coniferous stands (20%), mixed hard/softwood stands (7%), and ponds/wetlands (19%, Kramer et al., 2022). There were limited permanent developed surfaces within the core area except for 3 roadways, with forests and wetlands accounting for over 90% of the landscape.
METHODS
Aerial surveys
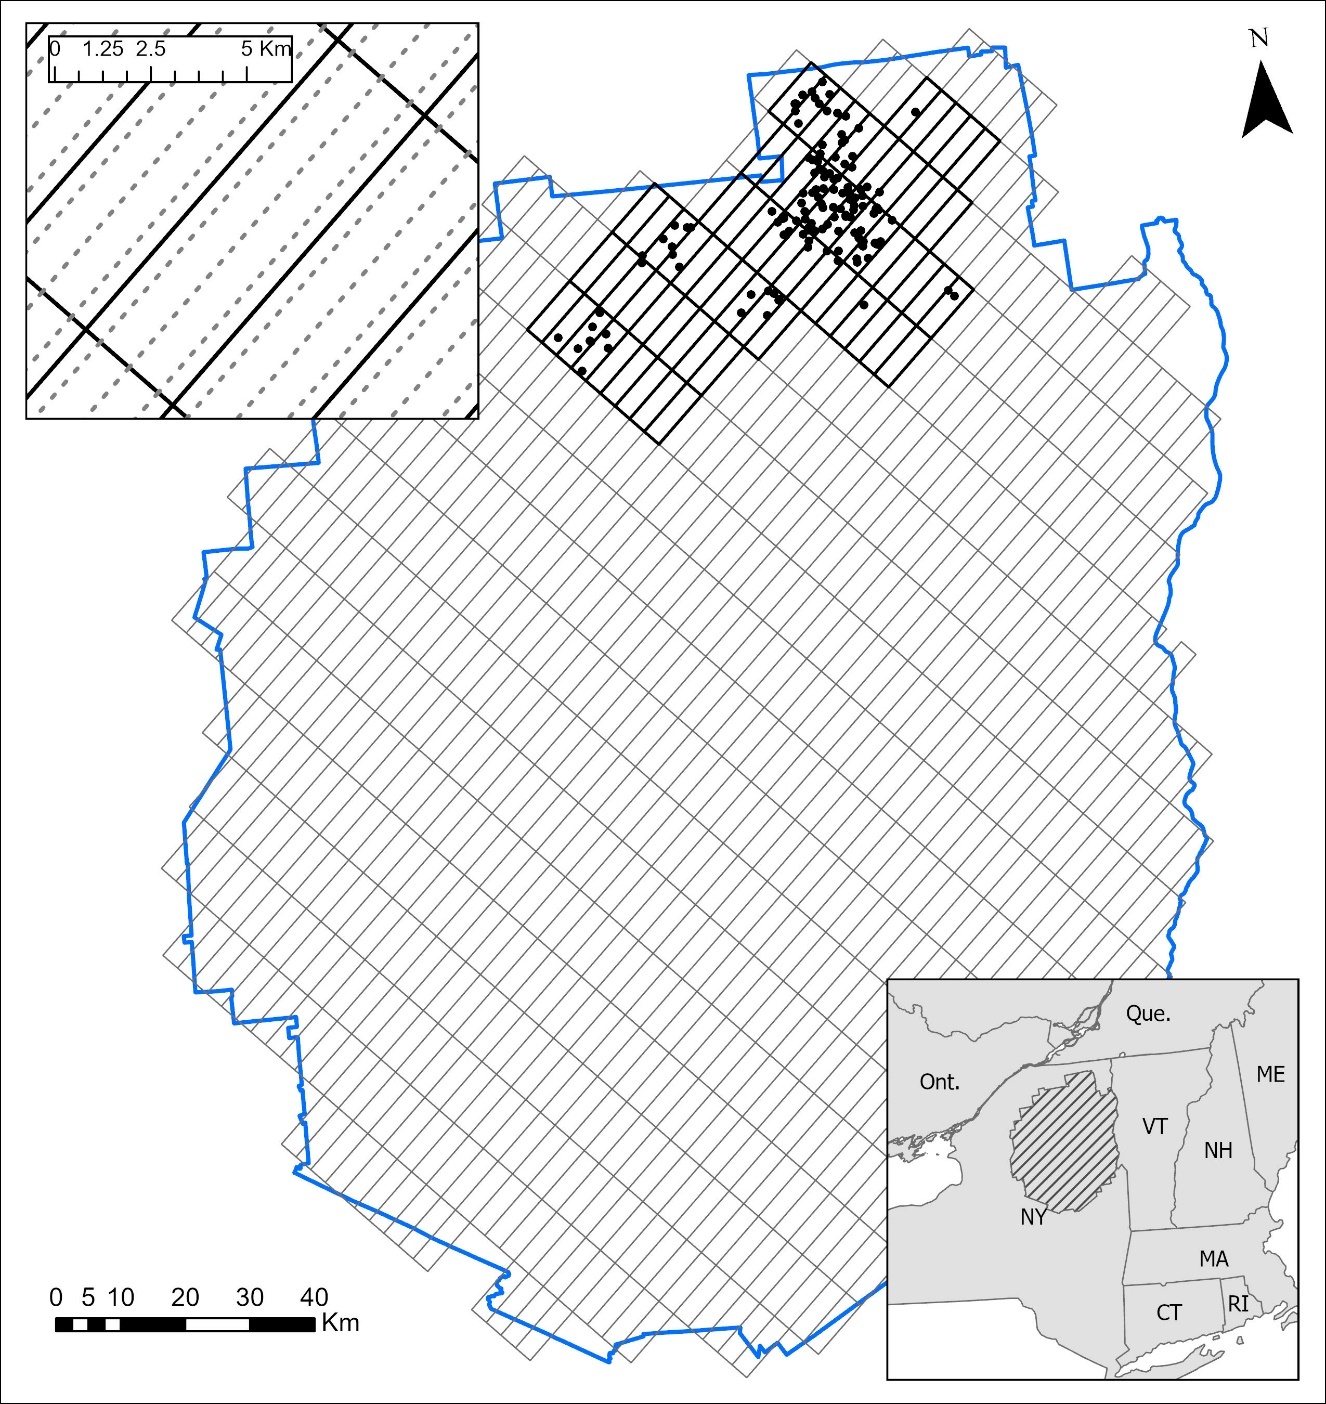
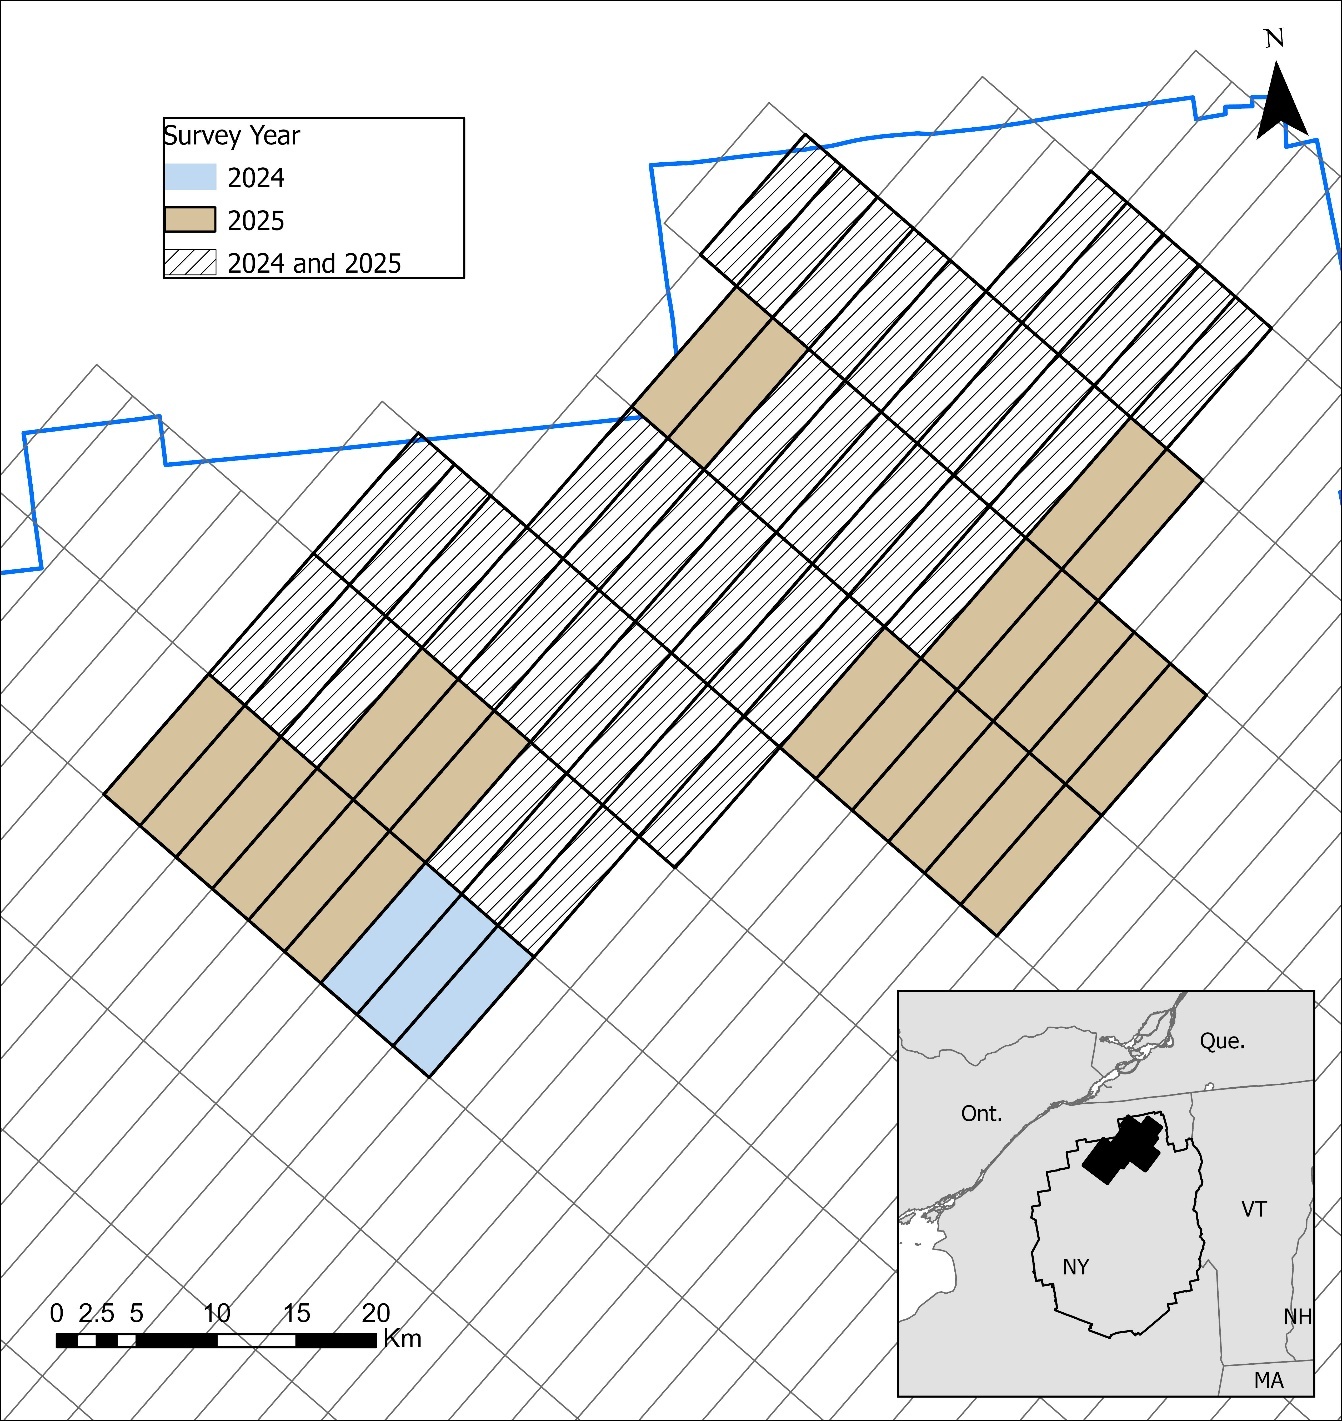
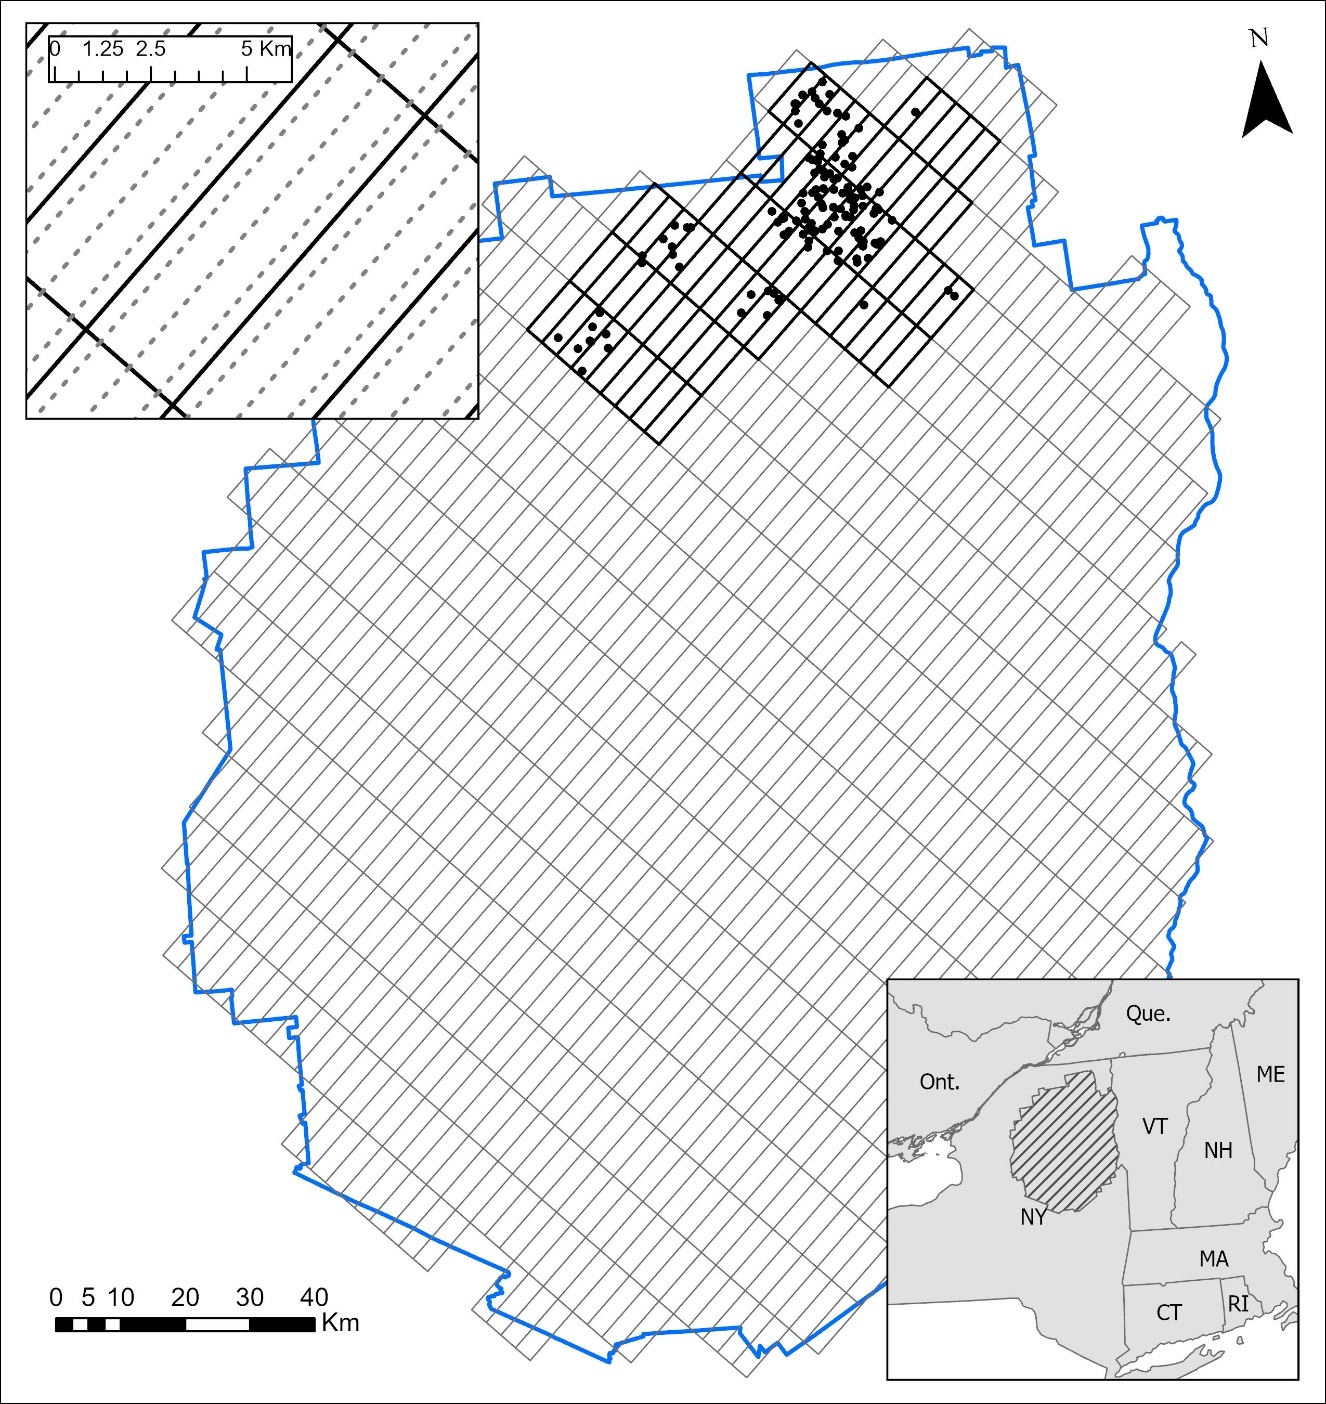
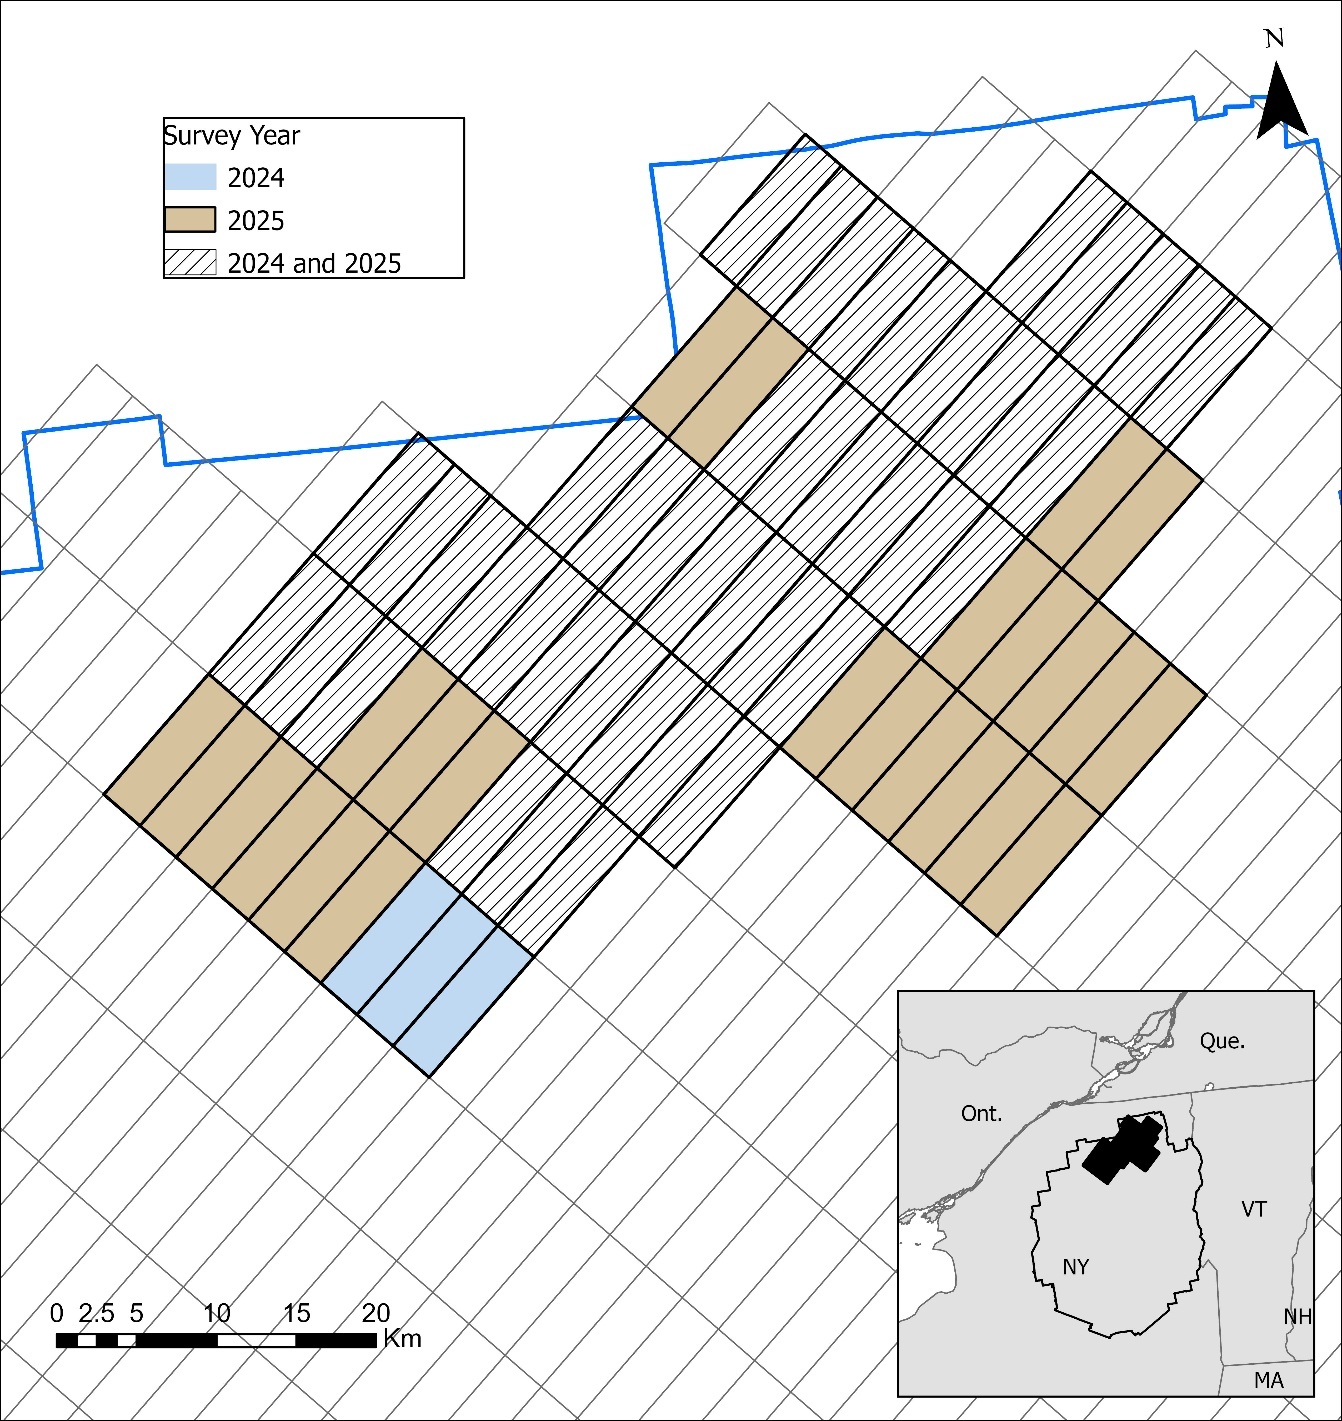
We conducted aerial surveys for moose in 2018—2020, and again in 2024—2025. For the recent (2024−25) surveys, we used methods first deployed in Hinton et al. (2022). We made use of a previously established grid network of 10km x 3km (n = 784) survey blocks throughout the Park (Fig. 1) that were oriented to follow the prevailing terrain gradient. Within each survey block, we placed 3 10-km parallel transects spaced 1km apart (Fig. 1, inset). The core area consisted of 70 survey blocks (2,100 km2 in total), located in the northeastern corner of the Park (Fig. 2). When a block was sampled, each of 3 transects would be completed during the survey day; neighboring blocks were often sampled during the same day to increase sampling efficiency.
We used a Robinson 44 helicopter (Robinson Helicopter, Torrance, CA, USA) for surveys conducted during January- March 2018- 20, and an Airbus AS350 helicopter (Airbus SE, Blagnac, France) for surveys conducted in 2024−25. In each aircraft, the survey crew included a pilot, navigator and 2 or 3 additional observers, with the rear observers responsible for recording data and managing a digital camera. The navigator recorded the entire flightpath using the QGIS geographic information system (QGIS Development Team, 2015) on a tablet that had been pre-loaded with transect start/end points. A handheld GPS unit was used as a backup. We optimized moose detection by flying on days with limited cloud cover and ample snow coverage (Kantar & Cumberland, 2013). Flight duration varied by survey day; however, flights generally occurred from sunrise until early afternoon, with fueling breaks mid-day (3-6 hours of flight time/day).
During each survey, the pilot followed a predetermined transect at an altitude of 60 m above ground level and traveled at a speed of 50-60 km/hour. When the flight crew detected a moose, the pilot flew to the approximate location of the initial sighting, and the crew then acquired a GPS location and determined the group size, sex (male, female, or unknown), and age class (adult, young of the year, or unknown) of the animal. For each detection, the flight crew documented time of sighting, percent cloud cover, air temperature, and habitat type (Conifer/Mixed, Hardwood, or Open/Cut/Regenerating). The perpendicular distance of the sighting from the transect was calculated upon survey completion using ArcGIS Pro software (Esri, Redlands, CA, USA). We pooled flight data from a previous sampling period in 2018-2020 (Hinton et al., 2022), with the flights from 2024 and 2025 to develop a robust detection function. In instances where blocks were resampled in a given sampling year, we only used data from the first sample in that year.
Analysis
We fitted standard distance sampling models using package Distance (Miller et al., 2019) in R (version 4.4.1, R Core Team, 2024). We truncated sightings to 500m to reduce the likelihood of double-counting an individual on a subsequent transect within the same day (Southwell & Weaver, 1993). Although it is possible individuals may have moved into a neighboring transect following the initial sighting disturbance, time between adjacent transect surveys was usually limited to 30 to 60 minutes. We considered 2 distance key functions (half-normal and hazard-rate) and 4 covariates (none, habitat type, group size, and habitat type X group size) to fit 8 competing distance sampling models. We combined each of the key functions with covariate models: a null model, a univariate model containing group size, univariate model including habitat type, and a model with both group size and habitat type. We limited the number and combinations of covariates to avoid overparameterization. We found it difficult to account for observer fatigue in a logical way because fatigue is influenced not only by flight time, but also by prior detections in any given day (i.e., observers may be more diligent when previous sightings may have occurred). Therefore, we did not include observer fatigue in any models. We ranked candidate models using Akaike’s Information Criterion (AIC; Burnham & Anderson, 2004), and conducted a Cramér-von Mises test to assess goodness-of-fit (Miller et al., 2019). If the Cramér-von Mises test was non-significant (P > 0.05), we accepted the null hypothesis to fit the model. We considered models within 2 AIC units of the top model to have similar support and considered the model with the fewest covariates and the highest Cramér-von Mises value as the top model. We calculated moose abundance using the Horvitz-Thompson-like estimator with 95% confidence intervals using maximum likelihood (Marques & Buckland, 2003; Miller et al., 2019; Oedekoven et al., 2013). We corrected the Horvitz-Thompson-like estimate with the mean observed group size to calculate the estimated total number of individual moose in each survey block.
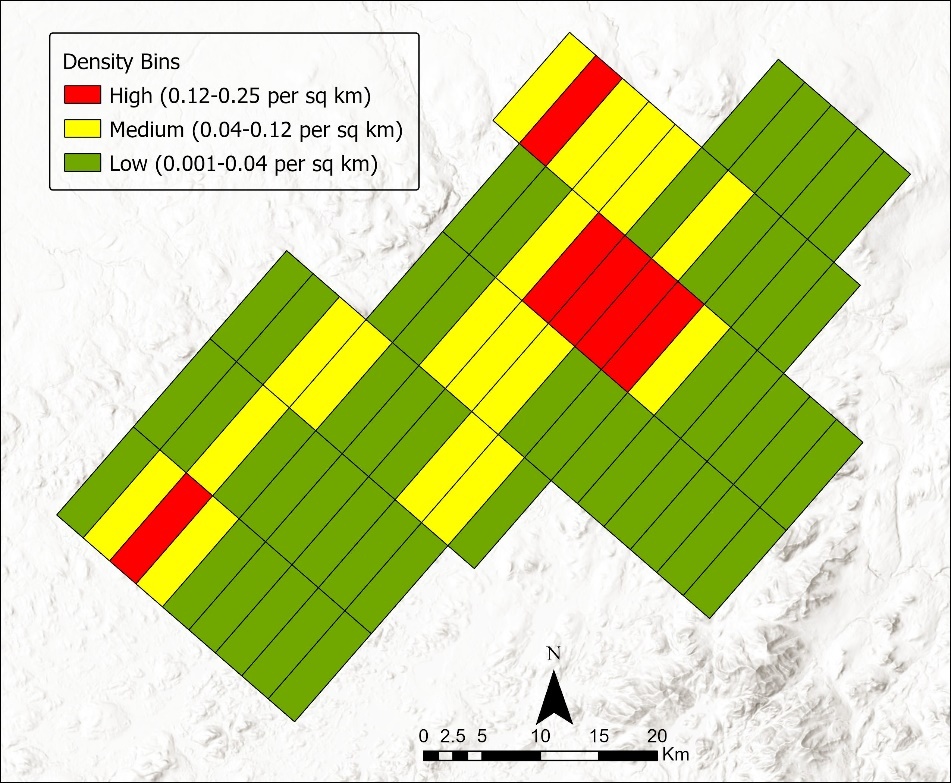
To address unsampled blocks within the core area, we employed point density estimation using all individual moose sightings (n = 259) from the 136 moose groups detected in the core area from 2018-2025. We calculated a point density neighborhood using a 1.4 km neighborhood radius and a Gaussian distribution (ArcPro 3.6.0, ESRI, Redlands, CA, USA and extracted the mean value per sampling block. All blocks were sampled at least once from 2018-25. We divided the mean point density estimate by the number of years in which the block was sampled, to account for repeated sampling of the same block across years. We then used a natural breaks Jenks binning algorithm (de Smith et al., 2025) to stratify the blocks post hoc into one of 3 density bins (high, medium, and low). We used the abundance estimates for a given sampling year and assigned the mean population densities per stratum to unsampled blocks in the corresponding stratum.
RESULTS
Detection function
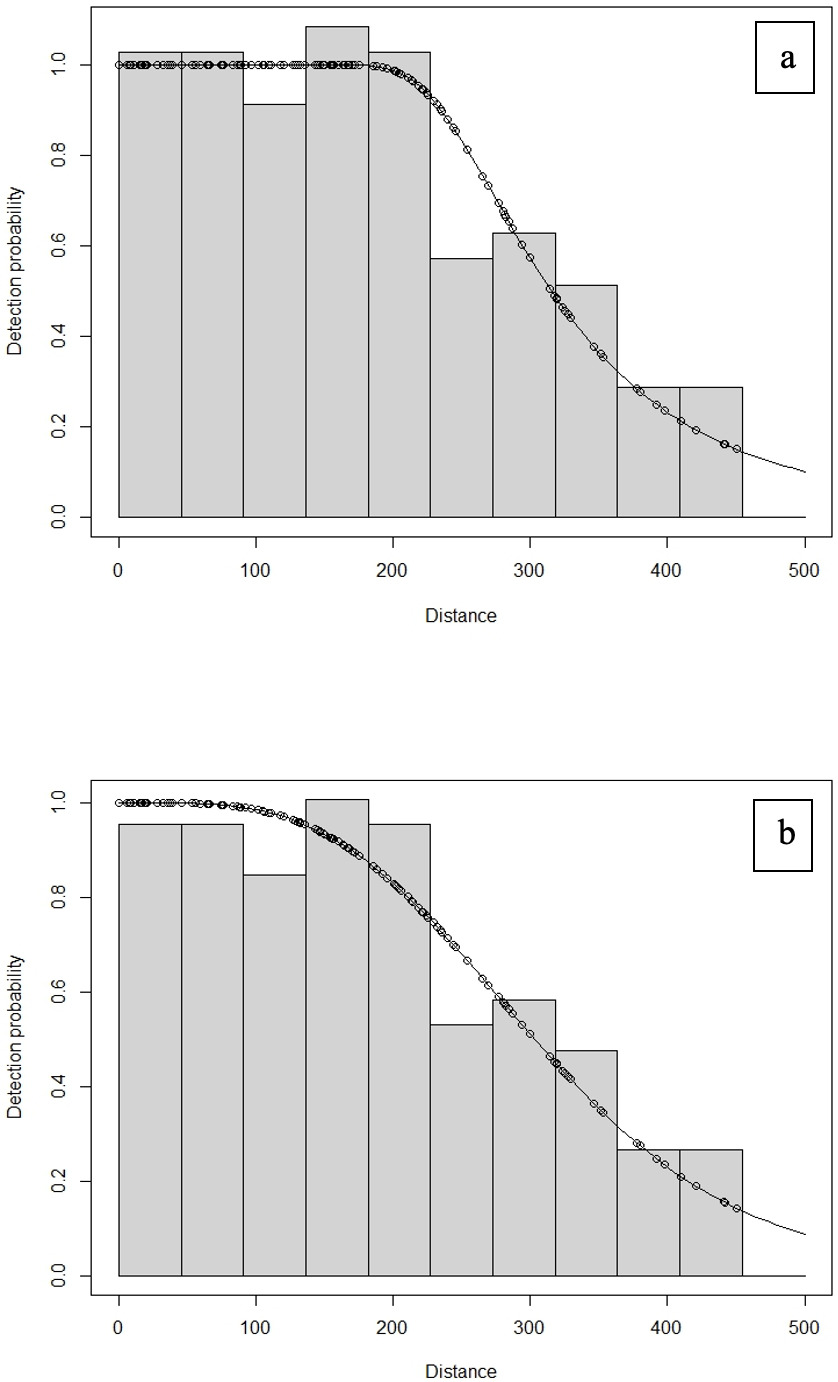
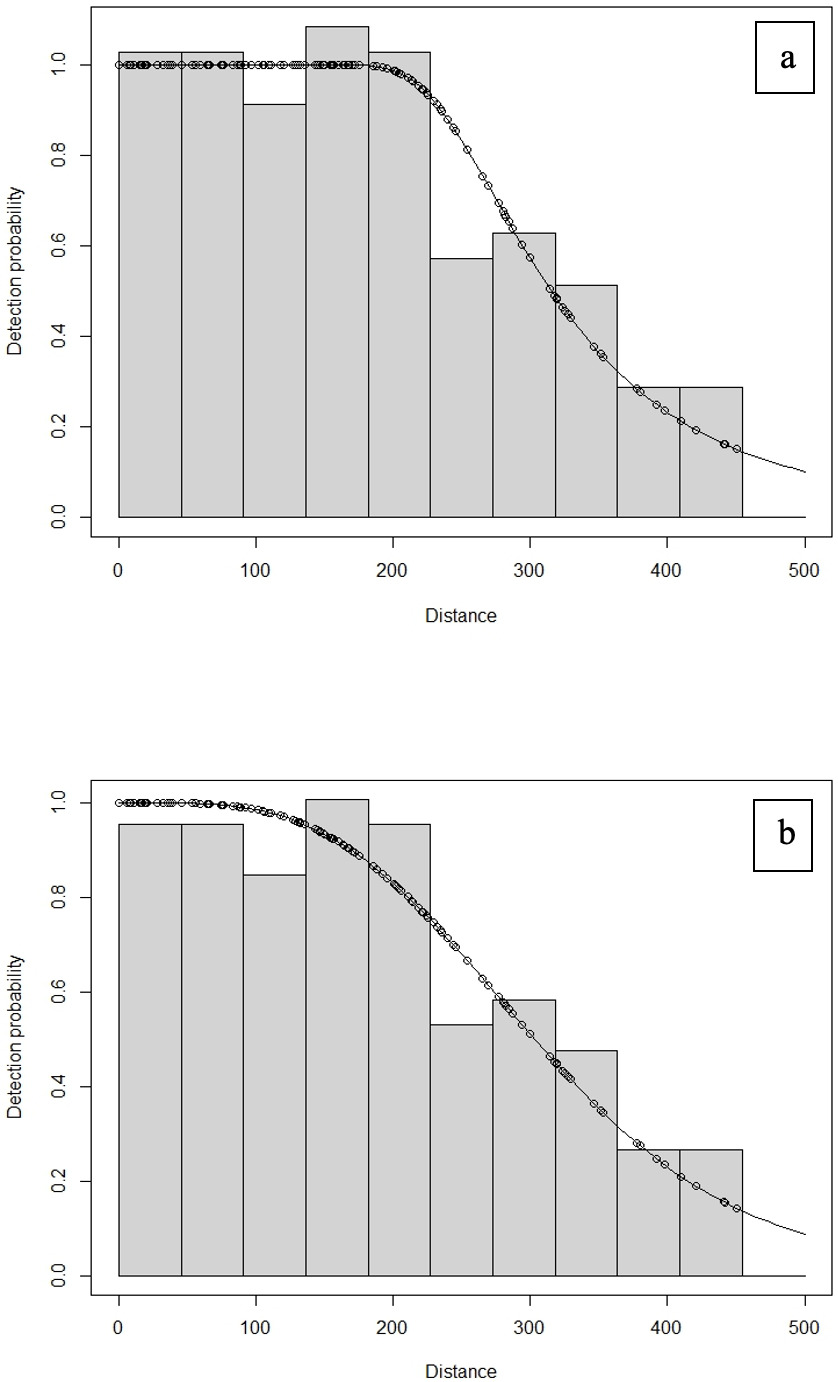
We surveyed a total of 178 blocks (with 3 transects each, total transects = 534) during 2018-25 (Table 1) in the core area. During 2018-2020, we surveyed 26, 22 and 15 blocks in the core area, whereas in 2024 and 2025 we covered a greater proportion of core area blocks (46 and 67 blocks sampled, respectively). Across all years, we detected a total of 136 moose groups with a mean group size of 1.9 moose and a total of 259 individuals. The mean number of moose group detections per transect was 0.25 (range = 0.00–0.40). The top model was a null model that used a hazard-rate key function (Fig. 3a, Table 2). The model goodness-of-fit was adequate based on a Cramér-von Mises test (CvM p-value = 1.00). The average moose detection probability was 0.67 (95% CI = 0.63−0.71). The null top models using the half-normal key function (Fig. 3b) yielded similar results, with an average detection probability of 0.62 (CI = 0.57−0.67). Moose were identified in all 3 habitat types, although were seen more frequently in the conifer/mixed forest type (43.4% of observations), than in hardwood (19.1%) or and open/cut/regenerating stands (37.5%). Habitat type was not supported as a covariate in either of the top models.
Density estimation
The estimated number of moose groups was 38.7 in 2024 and 60.7 in 2025 (Table 3). Of the 70 core area blocks, 47 were identified using procedures of de Smith et al. (2025) as low moose density bins (0.001-0.04 moose per km2; Fig. 4), 17 as medium moose density bins (0.04-0.12 moose per km2), and 6 as high moose density bins (0.12-0.25 moose per km2). We surveyed 26 low, 15 medium, and 5 high-density blocks in 2024 (65% of all core area blocks) and 44 low, 17 medium and 6 high blocks in 2025 (96% of all core area blocks). Incorporating mean group size and extrapolating across unsampled blocks (23 in 2024, 3 in 2025), we estimated 92 (95% CI 60.3−140.5) and 111.9 (95% CI 75.4−166.3) moose within the core area during 2024 and 2025, respectively (Table 4).
_sampling_blocks_surveyed_fro.jpeg)
DISCUSSION
We sought to adapt a previously used distance sampling method (Hinton et al., 2022) to improve the precision of moose population estimates in a portion of Adirondack Park. Following the first year of surveys in 2024, we realized that we would be unable to collect enough spatially independent moose sightings (Buckland et al., 2001) while using survey resampling of areas with the highest moose density. Therefore, we transitioned away from the previously used principal component density surface model (Hinton et al., 2022) and used traditional distance sampling and an extrapolation method that used simple sighting densities. Our experience highlights that management objectives may change over time, and that even the most thoroughly considered methods may require adaptation during implementation.
In past iterations of our moose survey, we sought to estimate a parkwide estimate, but were similarly unable to accumulate an adequate number (60-80) of spatially independent moose detections to adequately parameterize a detection function. Hinton et al. (2022) resolved the issue of lower-than-anticipated observations by resampling blocks with the highest density. Here, our objective was to estimate the moose population in our most densely populated region (core area) of the Park, in hopes of both detecting enough individuals to develop a robust detection function in one sampling year and to increase the precision of our moose population estimate to enable use of the core area as an indicator for the status of the population park-wide, all while reducing our annual flight time. As it became apparent after the first days of flights in 2024 that we would likely be unable to collect enough moose sightings during one flight year without resampling, a handful of blocks were resampled. Following the 2024 flights, we determined that given the static nature of our habitat (i.e., Forever Wild restriction and limited annual timber harvest), it would be acceptable to pool moose sightings across several recent moose surveys (i.e., 2018-2020) for the detection function, allowing us to avoid block resampling going forward, hence the greater proportion of core area blocks sampled in 2025.
In contrast to previous surveys using distance sampling (Andreozzi et al., 2016; McMahon et al., 2021; Moll et al., 2022; Sovie et al., 2023), we did not find that habitat was a significant covariate for the detection function. This may a be a result of the methodology used for survey flights, or the nuances of the forest composition in the study area. First, we conducted surveys at a lower altitude (60 m) than other survey attempts (150 m; Sovie et al., 2023, p. 610 m; Abouelezz & Hobbs, 2025, pp. 600–833 m; Bontaites et al., 2000), which may have resulted in higher moose sightability if individuals were closer to the aircraft and more obvious to the observers regardless of habitat type. For example, the recent work by Sovie et al. (2023) used similar sampling design and aircraft but flew 90 m higher in altitude and had a lower average detection probability (0.40). Second, habitat classification was conducted by the observers at the time of sighting and was limited to one of only 3 types (conifer/mixed, hardwood, and open/cut/regenerating). The coarse and qualitative nature of our habitat identification and the lack of up-to-date forest classification (Kramer et al., 2024) may have hindered our ability to detect differences in sightability across the 3 habitat types. Lastly, because our objective was to establish a population estimate in the core area of the Park, we sampled that section of the Park with the greatest amount of optimal moose habitat (e.g., commercial timber harvest). The habitat composition in that area of the Park is an interspersion of regenerating forest and mature stands, so it is likely that all 3 cover types were within a reasonable distance from any moose location (and we have previously documented non-differential use of those habitat types during normal winter conditions (Kramer et al., 2024)).
In our previous attempt to estimate a Park-wide estimate for a moose population (Hinton et al., 2022), we used principal components analysis (PCA; Maćkiewicz & Ratajczak, 1993) and density surface modeling (Miller et al., 2021) to extrapolate our population estimate using a limited number of sampling blocks (19% of the Park). Here, we chose to limit the amount of complex modeling during our most recent survey over concerns regarding our past density surface modeling approach. Although the use of the PCA framework was effective at estimating a population estimate for the Park, we believe it to be difficult to replicate over time because future PCA variable factor loads may differ, and model outputs can be difficult to interpret, and because PCA frameworks require linearity that may mask nuanced, non-linear ecological relationships. Furthermore, our choice here to use point density estimation derived from survey data to establish low, medium and high-density bins allowed us to extrapolate to the handful of unsampled blocks in 2024 and 2025, without having to rely on coarse habitat covariates that may have failed to address the nuance of habitat interspersion and may not have been reflective of current habitat conditions. The simplicity of our design was intended to facilitate replication in future aerial surveys, thus developing comparable population estimates over time without the need for complex modeling.
However, our results here failed to meet our objective of developing a population estimate with greater precision than Hinton et al. (2022), which we had considered a prerequisite before wildlife managers could use the core area estimate as an index to population status Park-wide. We attribute this failure largely to the low-density nature of the New York moose population. Moose aerial surveys conducted by management agencies have similarly resulted in large confidence intervals (20-30%) for population estimates derived from distance sampling (e.g., Abouelezz & Hobbs, 2025; Airst & Tomie, 2023; Hinton et al., 2022; Sovie et al., 2023). If a jurisdiction is implementing population surveys frequently, the precision of an individual year may be of less consequence, particularly if trends are easily detectable. However, the lack of precision may be more impactful for jurisdictions that only conduct periodic surveys (>3 years). We encourage managers to evaluate the purpose of population estimates prior to conducting surveys. Although population estimates are a useful monitoring metric for outreach and communication to the general public, the large confidence intervals that accompanied our point estimate for this low-density moose population suggest that alternative monitoring techniques should be explored going forward.
ACKNOWLEDGEMENTS
We thank all the NYSDEC staff, Wings Air and North Country Heliflite who performed the aerial surveys. Funding was provided by Federal Aid in Wildlife Restoration Grants W-173-G.