Advancements in biotelemetry since the 1980’s have greatly improved the ability of biologists to study the physiology, behavior, and energetic needs of free-ranging animals (Cooke et al., 2004). Researchers have gained insight into the ecology and behavior of wildlife species that are typically difficult to study, while simultaneously reducing the potential for the observation protocol to affect animal behavior (Ware et al., 2015). Biotelemetry technology can be used to investigate how fine-scale activity patterns change in response to time of day, season, and landscape context. These patterns are fundamental for understanding behavioral ecology and the complex trade-offs between balancing an organism’s physiological needs in response to environmental pressure and habitat availability, with direct applications for the management and conservation of imperiled species (Gervasi et al., 2006). The tracking and biometric technologies available on many Global Positioning System (GPS) collars have reached a point where we can now study these interactions at spatial and temporal scales much finer than what was previously possible (Williams et al., 2020).
Global positioning system collars offer many advantages over traditional Very High Frequency (VHF) collars, including, among others: greater sampling frequency (especially where sampling is limited by personnel, diel cycles, budget, and/or weather constraints), higher spatial accuracy, and no observation disturbance (Obbard et al., 1998). Many of today’s GPS collars are also equipped with activity sensors that detect and record changes in body movements as a measure of an animal’s activity (Ungar et al., 2005). These sensors provide a unique opportunity for researchers to remotely predict and understand behavioral states in free-ranging animals (Löttker et al., 2009; Roberts et al., 2016; Ungar et al., 2010). Though progress in biotelemetry technology has allowed activity sensors to decrease in size and weight while simultaneously recording more data (Kooyman, 2004), battery life, data storage capacity, and data transmission are still the main constraining factors in many activity sensor applications (Halsey et al., 2009). Despite the potential to gain insight into an animal’s response to its environment using behavioral states classified from activity sensors, relatively few studies have taken advantage of this technology due to a lack of understanding of how well activity sensors can predict specific behaviors.
Some of the first attempts to pair animal movements with activity sensor data utilized locations obtained from VHF collars and tilt-switch activity sensors. These studies have been able to distinguish active versus resting states with varying degrees of success for moose (Bevins et al., 1998), mule deer (Odocoileus hemionus; Relyea et al., 1994), caribou (Rangifer tarandus; J. A. K. Maier & White, 1998), and American black bears (Ursus americanus; Garshelis & Pelton, 1980), among others. Technological advancements in the early 1990’s led to the development of activity sensors capable of detecting movement on both horizontal (X-axis) and vertical (Y-axis) planes. These dual-axis sensors are able to provide a measure of both intensity and duration of collar movement (Gervasi et al., 2006). Researchers have used these dual-axis activity sensors to distinguish foraging and resting bouts in white-tailed deer (Odocoileus virginianus; Coulombe et al., 2006), active versus inactive periods in bears (Ursus thibetanus, U. arctos; Gervasi et al., 2006; Kozakai et al., 2008; Yamazaki et al., 2008), elk (Cervus canadensis; Roberts et al., 2016), and moose (Alces alces; Moen et al., 1996), and resting, grazing, and traveling behaviors in cattle (Bos taurus; Augustine & Derner, 2013; Ungar et al., 2005). More recently, activity sensors capable of continuously recording and storing raw acceleration values for three axes (tri-axis) were used to accurately detect and predict fine-scale behavioral states in puma (Puma concolor; Wang et al., 2015), moose (Kirchner et al., 2023), cattle (Ungar et al., 2010), Eurasian badger (Meles meles; McClune et al., 2014), cheetahs (Acinonyx jubatus; Wilson et al., 2013), and griffon vultures (Gyps fulvus; Nathan et al., 2012), amongst others. However, tri-axis sensors are not without limitations, including but not limited to battery life, data transmission, and data storage concerns. Tri-axis accelerometers are now widely regarded as the state-of-the-art standard for fine-scale behavioral inference and allow for flexible post-hoc processing and classification. As a result, much recent methodological development has focused on tri-axis derived data sets. However, a substantial volume of dual-axis derived data still exists. Thus, there is still a need for analytical approaches for researchers who possess legacy dual-axis activity datasets but lack validated frameworks for extracting behavioral information from them.
Previous studies have described the numerous problems encountered when attempting to classify behaviors using activity sensor data (tilt switch, dual- and tri-axis) obtained from GPS collars (Löttker et al., 2009). The majority of studies using dual-axis activity sensors have been unsuccessful at discriminating beyond coarse (active vs rest) behaviors (Adrados et al., 2003; Coulombe et al., 2006; Gervasi et al., 2006). Löttker et al. (2009) were able to successfully classify 3 behavioral categories (resting, feeding/slow locomotion, and fast locomotion) using dual-axis sensors, but highlighted issues that arose from building models using only one observed behavioral state in a given observation interval. For example, free-ranging ungulates rarely exhibit singular behaviors for long periods of time (Gottardi et al., 2010) and there is a greater potential for misclassification of behaviors such as vigilance (Moen et al., 1996; Ungar et al., 2005). Studies that constructed models based on observation intervals of only one behavioral state or that chose to convert behavioral states to the mode observed much higher misclassification rates when applying predictive models to intervals containing more than one behavioral state (Löttker et al., 2009; Moen et al., 1996). Further, nearly all validation studies have utilized only a few captive animals due to the difficulty of observing many free-ranging species and were often reliant upon very limited observation hours. The aforementioned limitations have restricted researchers’ ability to extrapolate behavioral classifications of captive animals’ behaviors to free-ranging individuals. Although newer tri-axis-based approaches (e.g., Kirchner et al., 2023) offer clear advantages for behavioral classification, our objective was to complement this growing body of work by extending behavioral inference to the numerous legacy datasets generated using dual-axis activity sensors. Developing robust methods for interpreting these legacy data remains important for maximizing the scientific value of past investments in wildlife telemetry. To better address challenges associated with predicting categorical outcomes based on singular behaviors exhibited during time periods, we developed a dual-axis activity sensor-based approach that incorporates a natural combination of behaviors that can be used to predict the species’ behavioral states.
Moose, a large-bodied herbivore, are experiencing lower survival rates at the southern edge of their range than in more northerly locations (Dodge et al., 2004; Lenarz et al., 2010; Maskey, 2008; Murray et al., 2006). Moose are known to respond physiologically to warm ambient temperatures (McCann et al., 2013; Renecker & Hudson, 1986, 1989; Thompson, Crouse, Jaques, et al., 2020; Thompson, Crouse, McDonough, et al., 2020) and to alter their habitat selection when ambient temperatures increase (Schwab & Pitt, 1991; Street et al., 2015, 2016; van Beest et al., 2012) by selecting for habitats that act as thermal refuges (Dussault et al., 2004). These characteristics make moose an ideal candidate species for examining how environmental changes may affect the behavior of a mammal occupying its bioclimatic edge. In Minnesota, for example, moose have experienced population declines during recent decades (Giudice, 2023; Murray et al., 2006). Although the ultimate driver of recent population decline remains unknown, recent research has demonstrated that the majority of moose mortalities can be attributed to health-related causes (Carstensen et al., 2017; Murray et al., 2006). Diseases, parasites, predators, habitat alteration, and climate change are all factors that may be contributing, alone or in concert, to the population decline in Minnesota (Carstensen et al., 2017; Ditmer et al., 2020; Lenarz et al., 2009, 2010; Mech & Fieberg, 2014; Murray et al., 2006). Recently, Carstensen et al. (2024) documented that wild moose in Minnesota are experiencing heat stress in summer and that this is adversely impacting survival. The ability to predict behavioral states from GPS-collars equipped with activity sensors may offer insights into how moose alter their behaviors in response to environmental change.
Our goal was to develop an approach for predicting the proportion of time moose spend in different behavioral states over a given time period using activity sensor data. Specifically, our objectives were to: 1) determine if dual-axis activity sensors can accurately classify behavioral states in moose, and if so, 2) develop a predictive model that can be used to remotely infer behavioral states, and 3) examine the potential for using remotely predicted behavioral states to investigate fine-scale behavioral responses of moose to changes in ambient temperatures and time of day. We utilized multivariate multinomial regression models to examine how well dual-axis activity sensors from GPS-collared captive moose in Alaska can predict three behavioral states (resting, moving, foraging). Unlike previous studies utilizing dual-axis activity sensors, we did not constrain our analysis to time intervals that encompassed only one behavioral state, but focused on predicting the proportion of different behaviors within each observation window. Validating and better understanding the limitations of the activity sensors in a captive setting has direct applications for understanding moose behavioral responses to habitat and increasing ambient temperatures in wild populations.
Study Area
We studied captive female moose (n = 8) at the Kenai Moose Research Center (MRC; 970 ha) operated by the Alaska Department of Fish and Game on the Kenai National Wildlife Refuge. Captive moose were maintained in 260 ha outdoor enclosures that encompass a mix of boreal habitats dominated by spruce forest interspersed with mixed deciduous stands, shrublands, and wetlands similar to wild moose habitat on the Kenai Peninsula. None of the cow moose observed during the study were pregnant or accompanied by calves. Free-ranging captive moose naturally foraged within the enclosures without supplement during this study. Predation attempts from brown bears (Ursus arctos), black bears (Ursus americanus), and wolves (Canis lupus) are infrequent but do occur within the enclosures. We obtained weather data from a National Oceanic and Atmospheric Administration (NOAA), U.S. Climate Reference Network weather station (AK Kenai 29 ENE) located at the MRC (Diamond et al., 2013).
Methods
Animal Handling
We fit each moose with a GPS collar (GPS Plus Iridium; mass = 1,100 g; Vectronic Aerospace GmbH; Berlin, Germany) during routine immobilizations at the MRC, following the procedure outlined in Herberg et al. (2018). The GPS collars recorded location data on board in 30-minute intervals. Each GPS collar was equipped with a dual-axis acceleration sensor, generating acceleration values on both a horizontal (X-value) and vertical (Y-value) plane. Accelerometer counts (0–±255) were generated for each axis in quarter-second intervals as an absolute value. The differences in accelerometer values between each successive quarter-second interval (minus 5 to reduce accelerometer noise) were calculated and summed over the 296-second interval (hereafter referred to as 5-minute intervals). The resulting cumulative value was scaled by 250, with values >255 capped at 255, so that ultimately values ranged from 0 to 255 for each of the two axes. We removed, adjusted, and replaced GPS collars when necessary on each captive moose throughout the study without the need for immobilization. All procedures for care, handling, and experimentation at the MRC were approved by the Animal Care and Use Committee, Alaska Department of Fish and Game, Division of Wildlife Conservation (protocol No. 09-29 and protocol No. 2014-17).
Animal Observations
We conducted direct behavioral observations on all moose during January, April, July, and October 2015 to account for any seasonal effects. We conducted observations during two 6-hour-long intervals per moose per season over a 2-week period (for a total of 48 observation hrs/moose). Observation days and start times (0600 to 2200 hr) were randomly assigned in R for each moose within a 2-week period. each season and throughout each day from 0600 to 2200 hr regardless of weather conditions. We conducted behavioral observations within 10 m of moose, during which we recorded every change in behavior to the nearest second on either a Recon or Juno data logger (Trimble Navigation Limited, Sunnyvale, CA, USA) following an approach similar to Moen et al. (1996). We categorized behaviors observed as foraging at 3 different heights (low, medium, high), resting, ruminating, walking, standing, running, shaking, grooming, boxing (i.e., interacting with other moose when both front legs leave the ground), and drinking or eating snow (hereafter referred to as water intake) (Table 1). If we lost visual contact with a moose during the scheduled 6-hour observation, we relocated the moose using very-high-frequency telemetry, and we removed missing observations from subsequent analyses.
Weather and Temporal Covariates
We obtained local weather conditions from the National Oceanic and Atmospheric Administration (NOAA) Climate Reference Network (CRN) weather station located at the MRC (Alaska, USA, 66.7251, -150.4493; https://www.ncdc.noaa.gov/crn/qcdatasets.html). We calculated the angle of the sun to test how it might influence moose behavior; values were < 0° when the sun was below the horizon and > 0° when the sun was above the horizon. For example, crepuscular times were centered on zero with lowest values corresponding to the middle of the night and the highest values to mid-day when the sun is at its highest point. Seasons were assigned as follows: winter (1 November-31 March), spring (1 April-30 May), summer (1 June-31 August), and fall (1 September-31 October). Solar angles changed with each season, with larger negative values occurring during winter (i.e., less daylight) and greater positive values during summer (i.e., more daylight).
Activity Analysis
Time stamps of NOAA temperature measurements, behavioral observations, GPS locations, and activity sensor data were not always identical with each other. Consequently, we linearly interpolated temperature measurements and GPS locations between consecutive time stamps to match activity sensor time stamps, assuming that any change in ambient temperature was most likely linear within a 5-minute interval. We collapsed all classified behaviors into the following 3 categories due to the overlap in X- and Y-activity values of many behaviors as well as the large number of 5-minute intervals consisting of more than one behavior: resting, foraging, and moving (Table 1).
We first calculated the proportion of time spent in each behavior category for every 5-minute activity interval by summing the total time spent in each behavior category and dividing by the total interval time (~5 minutes). All behavioral proportions within a 5-minute activity interval summed to 1. We incorporated step length (the distance between two consecutive GPS relocations) into some of our models because it was shown by Gervasi et al. (2006) to allow for better distinction between resting behaviors with increased head movements and low exertion foraging/traveling behaviors. Step length was calculated using linearly interpolated GPS locations to match the resolution of activity data.
We used compositional Dirichlet regression models (M. J. Maier, 2021) to quantify relationships between the proportion of time spent resting foraging and moving for each moose (i) within each 5-minute interval (j) and GPS-collar activity sensor values (X- and Y-values as well as step length. The Dirichlet distribution, often used as a prior in the Bayesian analysis of multinomial data, is not typically considered a response distribution (Gueorguieva et al., 2008). Dirichlet is well-suited for both skewed and constrained data (e.g., in our case, proportions of behavioral states). The Dirichlet distribution is a generalization of the beta distribution to higher dimensions, with k-dimensional vectors whose entries are real numbers in the bounded continuous interval (0,1) and We utilized the most common parameterization and modeled each concentration parameter (α) as follows:
Concentration:
\[\begin{aligned} \log\left( \propto_{i,j} \right) &= \beta_{0_{i}} + \beta_{1_{i}}X_{j} + \beta_{2_{i}}Y_{j}\\ & \quad + \beta_{3_{i}}{\ Step}_{j\ }(when\ applicable) \end{aligned}\]
with
Mean:
\[E\left( B_{i} \right) = \frac{\propto_{i}}{\sum_{k}^{\mathstrut} \propto_{k}}\]
Variance:
\[Var\left( B_{i} \right) = \frac{\propto_{i}( \propto_{0} - \propto_{i})}{\propto_{0}^{2}( \propto_{0} + 1)}\]
\[\propto_{0} = \sum_{k}^{\mathstrut} \propto_{k}\]
where = 1:number of behavioral states (resting, foraging, moving), = 1:number of activity intervals. The concentration parameter measures the extent to which the probability is concentrated near the mean.
We built 6 models within each season with explanatory variables 1) separately, 2) sum and 3) each with and without the addition of step length, resulting in a total of 24 models for each season. We evaluated models using a holdout cross-validation approach in which the data were randomly divided into a training (70%) and a validation (30%) set. Models were fit to the training set and then used to predict proportions of time spent resting, foraging, and moving during each 5-minute activity interval in the validation set. The predictive accuracy of the models was assessed using root mean squared error (RMSE), defined as: where was the i-th proportion of a specific behavior of the j-th validation, was the i-th predicted proportion of a specific behavior of the j-th validation, was the number of observations of the j-th validation, and k was the number of validations. We then fit the best model, as determined by the lowest RMSE, using all observational data and used it to predict proportions of time spent resting, foraging, and moving for all 5-minute activity intervals outside of observational time periods.
We examined the effects of ambient temperature and time of day (i.e., solar angle) on the proportion of time spent resting, foraging, and moving using our best predictive model that included step length. We predicted behavioral states for 5-minute intervals that occurred during our observation periods. Means and 95% confidence intervals were calculated for behavioral predictions and displayed using loess curves of 1,000 bootstrapped samples. Observed proportions were binned into 5% ambient temperature quantiles and compared to predictions. We then predicted behavioral states for all 5-minute intervals that occurred outside of observational time periods; predictions were binned into 5% ambient temperature quantiles to better visualize trends. Means and 95% confidence intervals were calculated for each bin using a bootstrap with 1,000 iterations. The same procedure was used to examine trends between predicted behavioral states and solar angle.
All statistical analyses were conducted using the R statistical software (R Core Team, 2023), using the ggplot2 (Wickham, 2016), moveHMM (Michelot et al., 2016), DirichletReg (M. J. Maier, 2021), and XTS libraries (Ryan et al., 2023).
Results
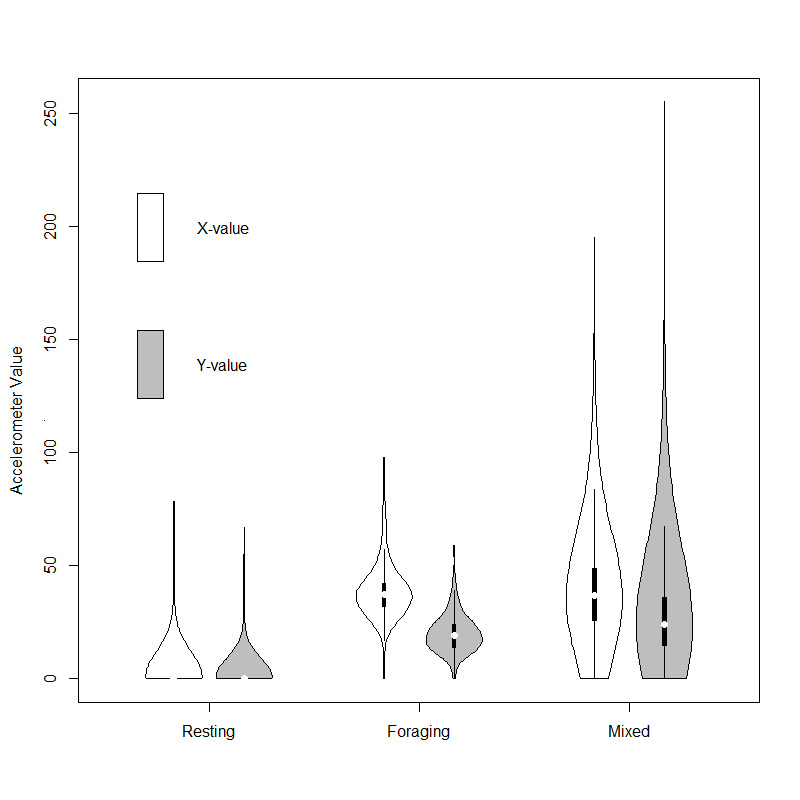
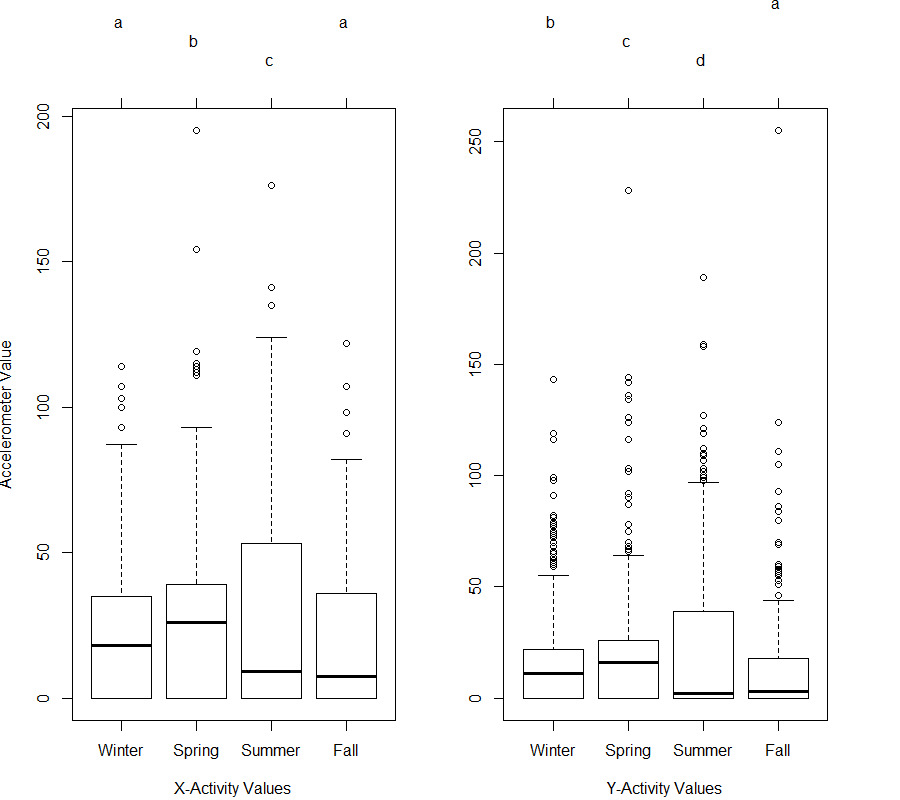
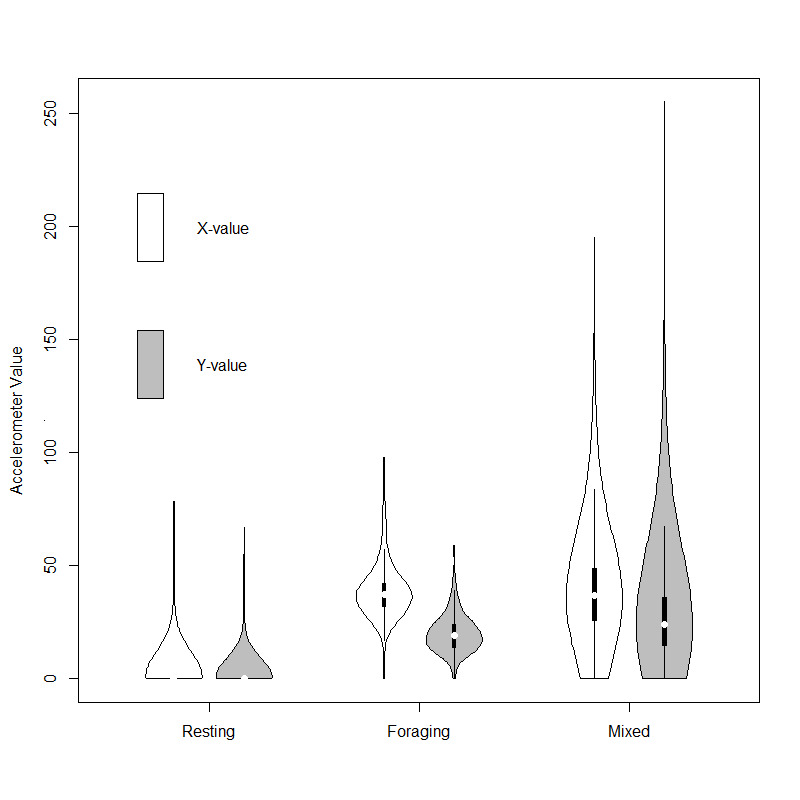
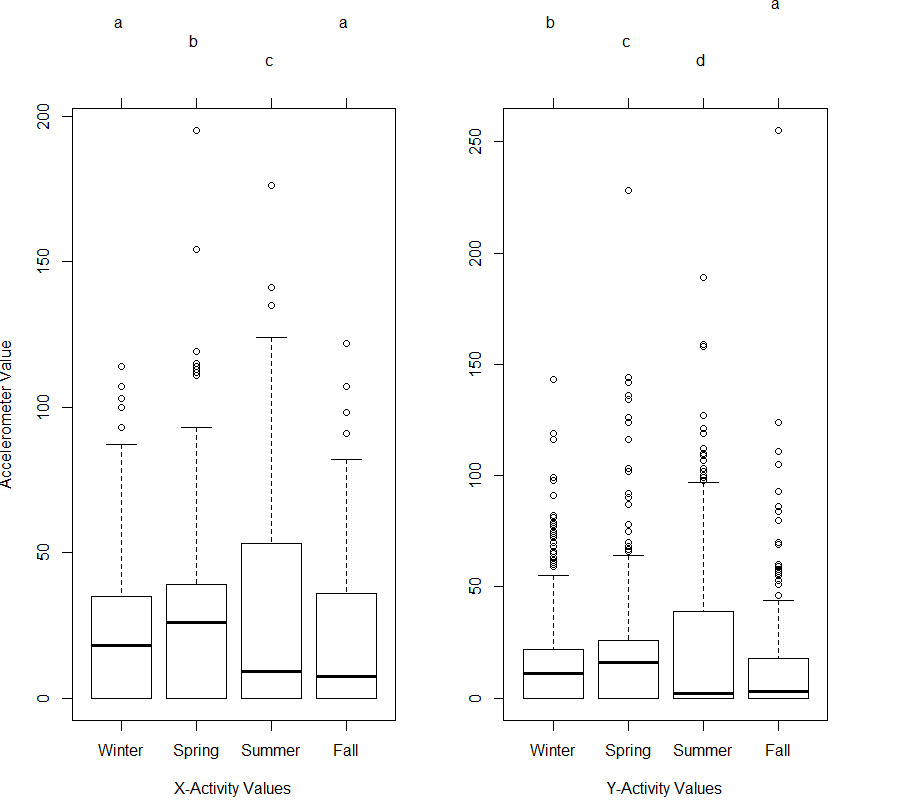
We classified behaviors during direct observations for 4,608 5-minute intervals from 8 moose across 4 seasons. Two 6-hour observation windows had to be removed from the analysis due to a misalignment of the Trimble clock and the GPS collar time. Two GPS collars failed over the course of the study (April 2015 and September 2015). After accounting for these issues as well as removing any intervals in which visual contact was lost between the observer and the moose, 3,501 5-minute intervals (291.75 hours) remained. Moose rested more during summer observation periods than other seasons, with moose being observed resting 67% of the time, whereas they were classified as foraging and moving 25% and 8% of the time, respectively. During spring, the moose spent more time classified as foraging (40%) relative to the other seasons (34% fall, 25% summer, 38% winter), 54% resting, and 6% moving. The proportion of time classified as moving was similar for all seasons and ranged from 6% to 8%. Of these 3,501 5-minute intervals, 1,559 (44%) consisted entirely of resting behaviors, 106 (3%) of foraging behaviors, whereas none consisted of only moving behaviors. Most 5-minute intervals (n = 1,836) consisted of more than one target behavior category (resting, foraging, and/or moving; hereafter referred to as mixed intervals). Mean X and Y values were lowest during pure resting intervals = 1.71, SD = 6.21; = 0.84, SD = 5.09) and highest for mixed intervals (X-value 39.13, SD = 23.75; Y-value 28.90, SD = 24.18; Fig. 1). Average X- and Y-activity values for all behavioral categorizations (resting, foraging, and mixed) varied significantly across seasons (ANOVAX: F3 = 22.13, P < 0.001; ANOVAY: F3 = 35.53, P < 0.001). X- and Y-values were consistently higher for all behavioral categories during spring and summer than fall and winter, with the highest values observed during summer. A post-hoc Tukey test showed that accelerometer data were significantly different among all seasons (adjusted P < 0.001) except for winter and fall season X-values (adjusted P = 0.78) (Fig. 2). These results justified the need to build different models for spring, summer, and combined fall/winter seasons, for a total of 18 models. We found no statistically significant variability in X and Y values among individuals within each season (results not shown).
Dirichlet models were fit to a total of 2,449 randomly chosen 5-minute intervals spread across the combined fall/winter (n = 1,199), spring (n = 578), and summer (n = 672) seasons. Models were evaluated using 1,052 5-minute intervals withheld from model building spread across fall/winter (n = 515), spring (n = 249), and summer (n = 288). The best model for all 3 seasons predicted the proportion of time spent resting, foraging, and moving as a function of X- and Y-values, the interaction between X- and Y-values, as well as step length (Table 2). The lowest RMSE was observed for the winter/fall model (RMSE = 0.1640), followed by summer (RMSE = 0.1871) and spring (RMSE = 0.2045).
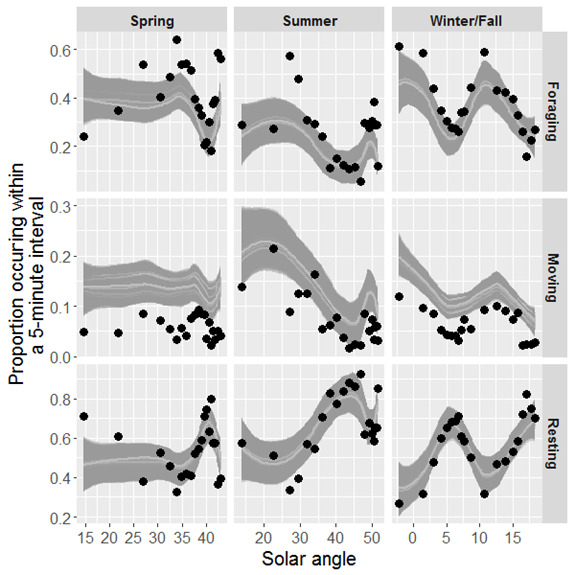
Comparisons were made between predicted and observed behavioral states in relation to time of day for 3,501 5-minute activity intervals. We found that prediction intervals for the proportion of time spent resting and foraging within a 5-minute interval encompassed the majority of observed behavioral proportions across a range of observed solar angles (Fig. 3). The proportion of time spent moving within a 5-minute interval was consistently over predicted, although minimally, for a range of observed solar angles (Fig. 3).
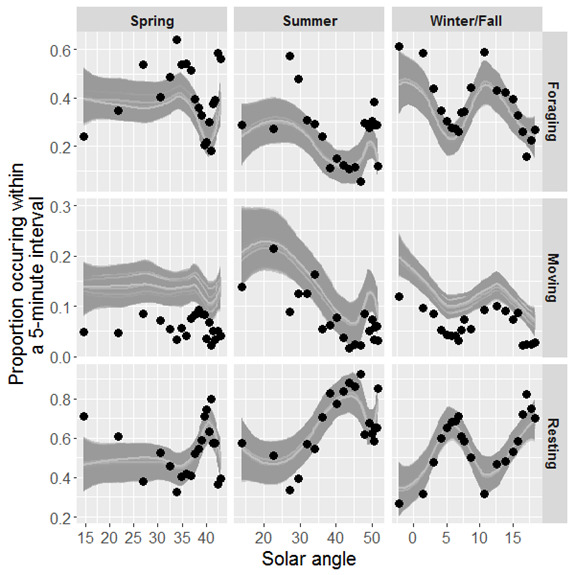
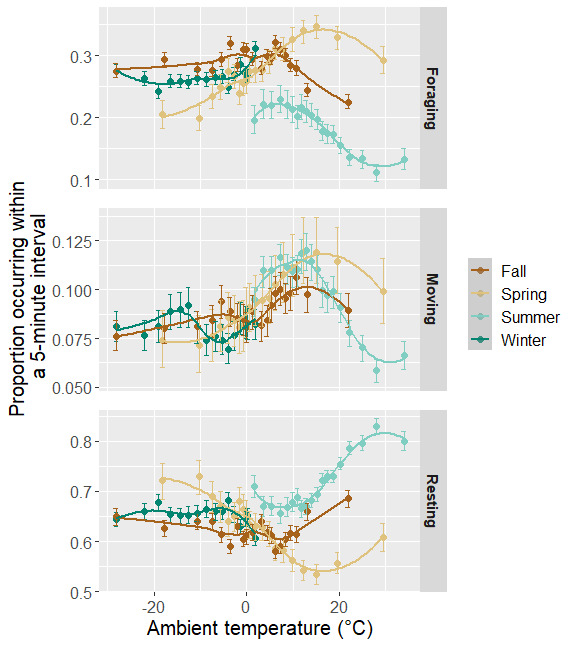
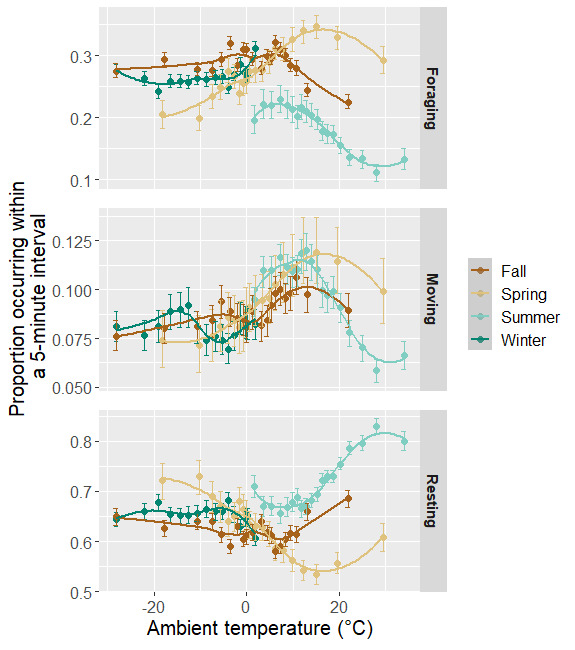
Using the best predictive models based on RMSE, we predicted the proportion of time spent resting, foraging, and moving for 789,957 5-minute intervals during 2015 across all seasons. Predicted intervals covered all seasons and did not include 5-minute intervals with behavioral observations. Moose altered their behavior across seasons based upon time of day (i.e., solar angle). During spring, summer, and fall, moose were more likely to increase the proportion of time they spent resting during the middle of the day (greatest angle of the sun) and the middle of the night (lowest angle of the sun), and were more likely to be foraging and moving during crepuscular periods. This pattern differed for winter; moose activity (foraging and moving) peaked during crepuscular times as well as the middle of the night. Along with the sun’s position, we observed changes in behavior in response to ambient temperature. During all seasons except winter we observed a positive relationship between the mean proportions of time spent resting and ambient temperature (Fig. 4, bottom panel). This relationship varied by season, with increases in rest occurring at higher temperatures during spring (>18°C) than summer (>16°C) and fall (10°C). We observed a slight increase in moving behavior at temperatures >25°C during summer (Fig. 4).
Discussion
We found that dual-axis activity sensors programmed to record activity values in 5-minute intervals can be used to accurately predict the proportion of time spent in behavioral categories defined as resting, foraging, and moving in moose. We observed slight improvements in behavioral state predictions with the addition of step-length derived from GPS fixes less than or equal to 30 minutes. Although previous studies have used behavioral observations of captive animals to validate collar activity sensors, most have selected time intervals consisting of only purely active or inactive behaviors to build predictive models (Löttker et al., 2009; Ungar et al., 2005). Studies that used time intervals encompassing more than one behavioral state typically converted intervals to the mode behavior observed within that time period (e.g., Moen et al., 1996), which often resulted in substantial increases in error when predicting intervals of mixed behaviors (Löttker et al., 2009; Moen et al., 1996). Nearly all of our observed active 5-minute time intervals contained a mixture of active behaviors (foraging, walking, running, boxing, drinking) and inactive behaviors (standing, vigilance). These observations were consistent with findings in captive roe deer (Capreolus capreolus), where nearly all observed active intervals contained inactive behaviors (Gottardi et al., 2010), further supporting the value of a modeling approach that incorporates a combination of behaviors in ruminants when studying fine-scale behavioral patterns. The Dirichlet modeling technique allowed us to incorporate mixed intervals (e.g., intervals that contained two or three of the target behaviors), which increased our prediction accuracy of intervals containing a variety of behavioral states. The absence of observed intervals consisting of purely moving behaviors highlights why models that assume a single behavioral state within each interval may be misleading. This also highlights some limitations of extrapolating observational studies of captive animals, as in our study, to free-ranging populations. Limitations of sampling captive animals include fewer predator encounters, small enclosure-size, and fewer available habitat types, which all likely contributed to the lack of observed moving behaviors >1 minute in duration during our study.
An important consideration when interpreting our results is that behavioral classifications were based on grouped (i.e., collapsed) activity signatures rather than uniquely identifiable behaviors as initially observed. Thus, our ability to predict time spent resting, foraging, and moving applies to these categories as defined by our classification scheme, not to individual behaviors within them. Some grouped behaviors differ in ecological function despite similar activity values; for example, the resting category included both bedded rest and standing/vigilance, and moving included grooming as well as locomotion. Consequently, changes in a behavioral category may reflect shifts in multiple underlying behaviors. For instance, an increase in resting under certain conditions could indicate more time spent bedded, more time vigilant, or both, with different ecological implications. Accordingly, these results should be interpreted at the level of grouped behavioral categories, particularly in the absence of direct behavioral observations.
Few studies have collected activity sensor data in conjunction with behavioral observations across multiple seasons, and only one involved moose (Kirchner et al., 2023). The significant differences we observed in dual-axis activity values among all 4 seasons suggest a need to develop more season-specific (i.e., spring, summer, fall/winter combined) predictive models. Several factors, alone or in concert, may influence the seasonal differences we observed. First, differences in a moose’s body condition throughout the course of a year have been observed to affect GPS collar fit, with the loosest fit occurring during spring and transitioning to the tightest fit during late fall/early winter. Average neck diameter decreased 6 cm from end of summer to late winter (D. Thompson, unpublished data). Thus, we expected higher activity values in the spring with a looser collar fit. Morphological differences between individuals could also explain some of seasonal variation in activity sensor values. Previous studies have found that collar fit can also vary depending upon sex and/or age class (Coulombe et al., 2006; Gervasi et al., 2006; Kirchner et al., 2023; Löttker et al., 2009). Löttker et al. (2009) found that activity values from male red deer were considerably lower than females, especially during high locomotion behaviors, but pooled data from both genders produced models that fit well for all of them. Kirchner et al. (2023) found that prediction misclassifications were most frequent with the one male moose in their study as well as large female moose; large head size and neck circumference were hypothesized to have influenced misclassifications. The inability to maintain close proximity to male moose for extended periods of time, as well as the low number of males housed at the MRC during 2015, limited our study to female moose. Because of this and previous findings, we recommend that activity values from wild male and female moose should be examined closely over the course of all seasons to adjust the predictive models, if necessary. We did not observe significant differences in X- and Y-values resulting from variation in individual moose collar fit or behavior. However, this could be due to the disposition of captive moose at the MRC. Ideally, the potential for variation in collar fit and behavior would be accounted for in the modeling process, but variables such as age or weight are difficult to determine in the field when collaring wild moose (Kirchner et al., 2023). Looser collar fit combined with increased foraging activity during spring and summer could explain the higher activity values observed during both resting and active 5-minute behavioral states during those seasons compared to winter and fall. Moen et al. (1996) found increased activity counts during summer due to a combination of increases in browsing and head movement needed to strip leaves and to avoid insect harassment.
We observed considerable overlap in X- and Y-axis activity values when comparing purely resting and foraging intervals. We found that during times of low exertion foraging (primarily foraging low) when browse was plentiful, neck movements were minimal and corresponding X- and Y-values were often <10. Sustained periods of walking with little to no neck movement also produces intervals with similarly low activity values. We observed periods of sustained walking along enclosure fence lines interspersed with standing behaviors that resulted in activity values lower than expected (<100). It should be noted that resting was not always associated with zero or very low activity sensor counts: we observed activity values as high as 116 and 81 for X- and Y-values respectively for 5-minute intervals consisting of only resting behaviors. This was attributed to considerable head movement during periods of rest, both in standing and bedded positions, corroborating the findings of Ungar et al. (2005) and Moen et al. (1996) that rest behaviors are not always associated with low activity counts. Moose observed bedding during insect harassment periods displayed increased head shakes, ear flicking, among other movements. Much of the overlap we encountered between behavioral categories was due to activity counts being effectively averaged over a 5-minute interval. Many of the issues we encountered could be alleviated by shortening the interval of the averaging process or instead storing raw acceleration values (Kirchner et al., 2023; Löttker et al., 2009). Kirchner et al. (2023) were able to successfully distinguish among 7 behaviors of moose recorded with tri-axis sensors summarized in 3 second intervals, but still encountered overlap in accelerometer signatures of behaviors considered exclusive (i.e., standing, foraging) leading to increased model misclassifications. These findings highlight that even state-of-the-art tri-axis derived data are not immune to classification challenges, particularly when behaviors share similar movement signatures. Consequently, analytical advances, rather than sensor technology alone, remain important for improving behavioral inference across both current and legacy telemetry datasets. Recent applications of machine learning to accelerometer data demonstrate that complex, non-linear behavioral patterns can be accurately predicted, but are not without challenges (Kirchner et al., 2023; Yu & Klaassen, 2021). We encourage researchers to explore multiple analytical pathways for remotely assessing animal behavior. Evaluating the relative performance of machine learning and regression-based approaches was beyond the scope of this study but would be useful in future work.
Using the Dirichlet regression modeling approach we were able to predict proportions of resting, foraging and moving across the different seasons with relatively good accuracy (RMSE <0.21 for all seasons, respectively). We observed prediction error from 2 main sources. Proportions of rest were over-predicted and foraging under-predicted during intervals in which low exertion foraging behaviors were the dominant behavior observed (i.e., foraging low during winter and early spring). The overlap in activity values between foraging and behaviors categorized as moving but with minimal neck movements (e.g., head down walking) also introduced error, resulting in over-prediction of the proportion of time spent foraging during these intervals. The addition of GPS movement path data to our models allowed for better distinction between periods of high-exertion foraging (e.g., stripping browse during summer) and moving behaviors with minimal neck movements. We expected step length to partially mitigate prediction error observed between resting and low-exertion foraging behaviors, but we obtained only minimal improvements. We suspect that this was due to the length of time between fixes (i.e., 30 min), and hypothesize that fix rates 10 minutes would help reduce this source of error. However, we acknowledge that battery life limitations make high fix rates unrealistic for most studies involving free ranging animals. The addition of movement paths should only be used when GPS fixes are 30 minutes apart. Attempts to utilize 60- and 120-minute fixes (via coarsening our location data) resulted in minimal prediction improvements and induced new sources of prediction error. We encourage researchers to pay close attention to these potential sources of error when interpreting results.
Captive moose we studied appeared to modify their behavior in response to changes in ambient temperature and solar angle. Indeed, moose have been shown to respond both behaviorally and physiologically to changes in ambient air temperature as part of a combined thermoregulatory response (McCann et al., 2013; Renecker & Hudson, 1986, 1989; Thompson, Crouse, Jaques, et al., 2020; Thompson, Crouse, McDonough, et al., 2020). We found that temperature-dependent changes in behavior were the least pronounced during winter for the moose at the MRC. Street et al. (2015) found slight increases in activity values at moderate temperatures during winter. These findings are corroborated by the slight increase in activity we observed as ambient temperatures increased toward 0°C. Well adapted to tolerate cold temperatures, moose are limited by both forage quantity and quality during the winter (Franzmann & Schwartz, 2007); this could explain why we observed relatively constant activity levels across much of the ambient temperature gradient during this season. During both summer and fall we saw marked decreases in the proportion of active behaviors as temperatures increased. The mean proportion of active behaviors decreased considerably at temperatures exceeding 15°C and 5°C during summer and fall respectively, suggesting that moose during these seasons are faced with the tradeoff between resting more frequently to reduce thermal stress and seeking quality food sources and foraging. Verzuh et al. (2022) found that moose spent 67.8% percent of daylight hours bedded during summer and selected bed sites that reduced risk of heat stress, supporting the theory that moose adjust their behavior in response to warm ambient temperatures. Forced to rest during times of increased ambient temperatures, moose forfeit feeding opportunities, and this deficit has been shown to reduce weight and overall body condition (Renecker & Hudson, 1990).
Thermal tolerances are known to shift seasonally for many species (Portner, 2002); we therefore expected a lower thermal threshold followed by marked decreases in activity during spring as a result of natural acclimation from the winter season hindered by remaining winter coats. Our results suggest, however, that when experiencing warm temperatures during late spring (i.e., May), moose may choose to take advantage of increased forage quality and abundance at the cost of potential thermal stress. As spring advances, rapid plant growth occurs and nutritional quality peaks. This time period also corresponds with peak energetic demands on gestating and lactating female moose (Franzmann & Schwartz, 2007); indeed, Gasaway and Coady (1974) found that the metabolizable energy requirement by the end of the gestation period was 6-fold compared to March. Parturition initiates an even more energy-demanding phase, 2- to 3-fold that of gestation. Energy needs therefore peak during the early summer and gradually decline as the young are weaned (Franzmann & Schwartz, 2007). However, none of the cow moose we observed during this study were pregnant or accompanied by calves, and thus our results may not fully reflect activity patterns and behavior responses under the elevated energetic demands associated with gestation and lactation.
Behavioral responses of moose to thermal conditions are consistent throughout much of North American moose range. Moose occupying the boreal forest in Québec utilized conifer forest as a thermal refuge more frequently when ambient temperatures were high (Dussault et al., 2004). Similarly, moose in British Columbia were found to select more for mature forest as ambient temperatures increased (Schwab & Pitt, 1991). We observed similar patterns at the MRC during this study, where moose utilizing conifer stands during both spring and summer rested more than those utilizing quaking aspen (Populus tremuloides) and birch (Betula spp.) stands, especially during the middle of the day when the sun and ambient temperatures were peaking. Additionally, moose in Wyoming were found to increase their selection for wet bed sites on both warm days and during the warmest periods of the day (Verzuh et al., 2021). At the MRC, we found that the captive moose that were using bogs during summer displayed high proportions of resting behaviors, which indicates that they may be using bogs as thermal refuges. We recommend that future efforts focus on incorporating movement, activity, and body temperature data to investigate fine-scale behavioral patterns of moose in response to changes to habitat and increasing ambient temperature.
With ambient temperatures forecasted to increase globally by as much as 4.4ºC by 2100 (IPCC, 2023), it is crucial that we improve our understanding of how moose occupying bioclimatic edges respond to warming temperatures. Although we were able to capture behavioral changes in relation to ambient temperature and time of day, we were unable to conclude whether these changes are related to warm ambient conditions without physiological data. The ability to pair behavioral changes with physiological measurements (e.g., heart rate and body temperature), taken by biologgers (mortality implant transmitters or vaginal implant transmitters, among others), would provide researchers with additional insights into how ambient temperatures influence survival, habitat use, and reproductive rates in free-ranging moose. Importantly, our approach is not intended to compete with tri-axis-based methods, but rather to complement them by extending the utility of historical dual-axis datasets. By providing a methodology to extract behavioral information from once commonly deployed dual-axis activity sensors, this approach allows researchers to address how animals respond behaviorally to changes in their environment at fine spatial and temporal scales. We recommend that future research use biologger technology in conjunction with GPS and activity data to better understand the behavioral and physiological responses of moose to changes in their environment.
Acknowledgments
We thank the Environment and Natural Resources Trust Fund, the Minnesota Department of Natural Resources, and the Minnesota Agricultural Experiment Station (Project #41-020) for funding this study. We thank M. King and W. Schock for their assistance with behavioral observations. E. Hildebrand and B. Wright provided guidance leading up to and throughout the field work. Thanks to the Forester Lab, Fieberg Lab, and Arnold Lab at the University of Minnesota for all their help and guidance over the course of this study.